> ## Documentation Index
> Fetch the complete documentation index at: https://agent-observability-docs.splunk.com/llms.txt
> Use this file to discover all available pages before exploring further.
# Compare Experiments
> Learn how to compare multiple experiment runs in Splunk Agent Observability
Once you have run some experiments, the next natural step is to compare the results of your experiments, allowing you to optimize prompts, select the best model for your use case, or tune your input data to suit your needs.
Splunk Agent Observability allows you to compare up to five different experiments, showing the difference in outputs, evaluators, latency, and token usage.
## Prerequisites
To compare experiments, you will need:
* A project containing two or more experiments, created either using [playgrounds](/concepts/experiments/running-experiments-in-console), or in [code](/sdk-api/experiments/running-experiments).
## Compare experiments
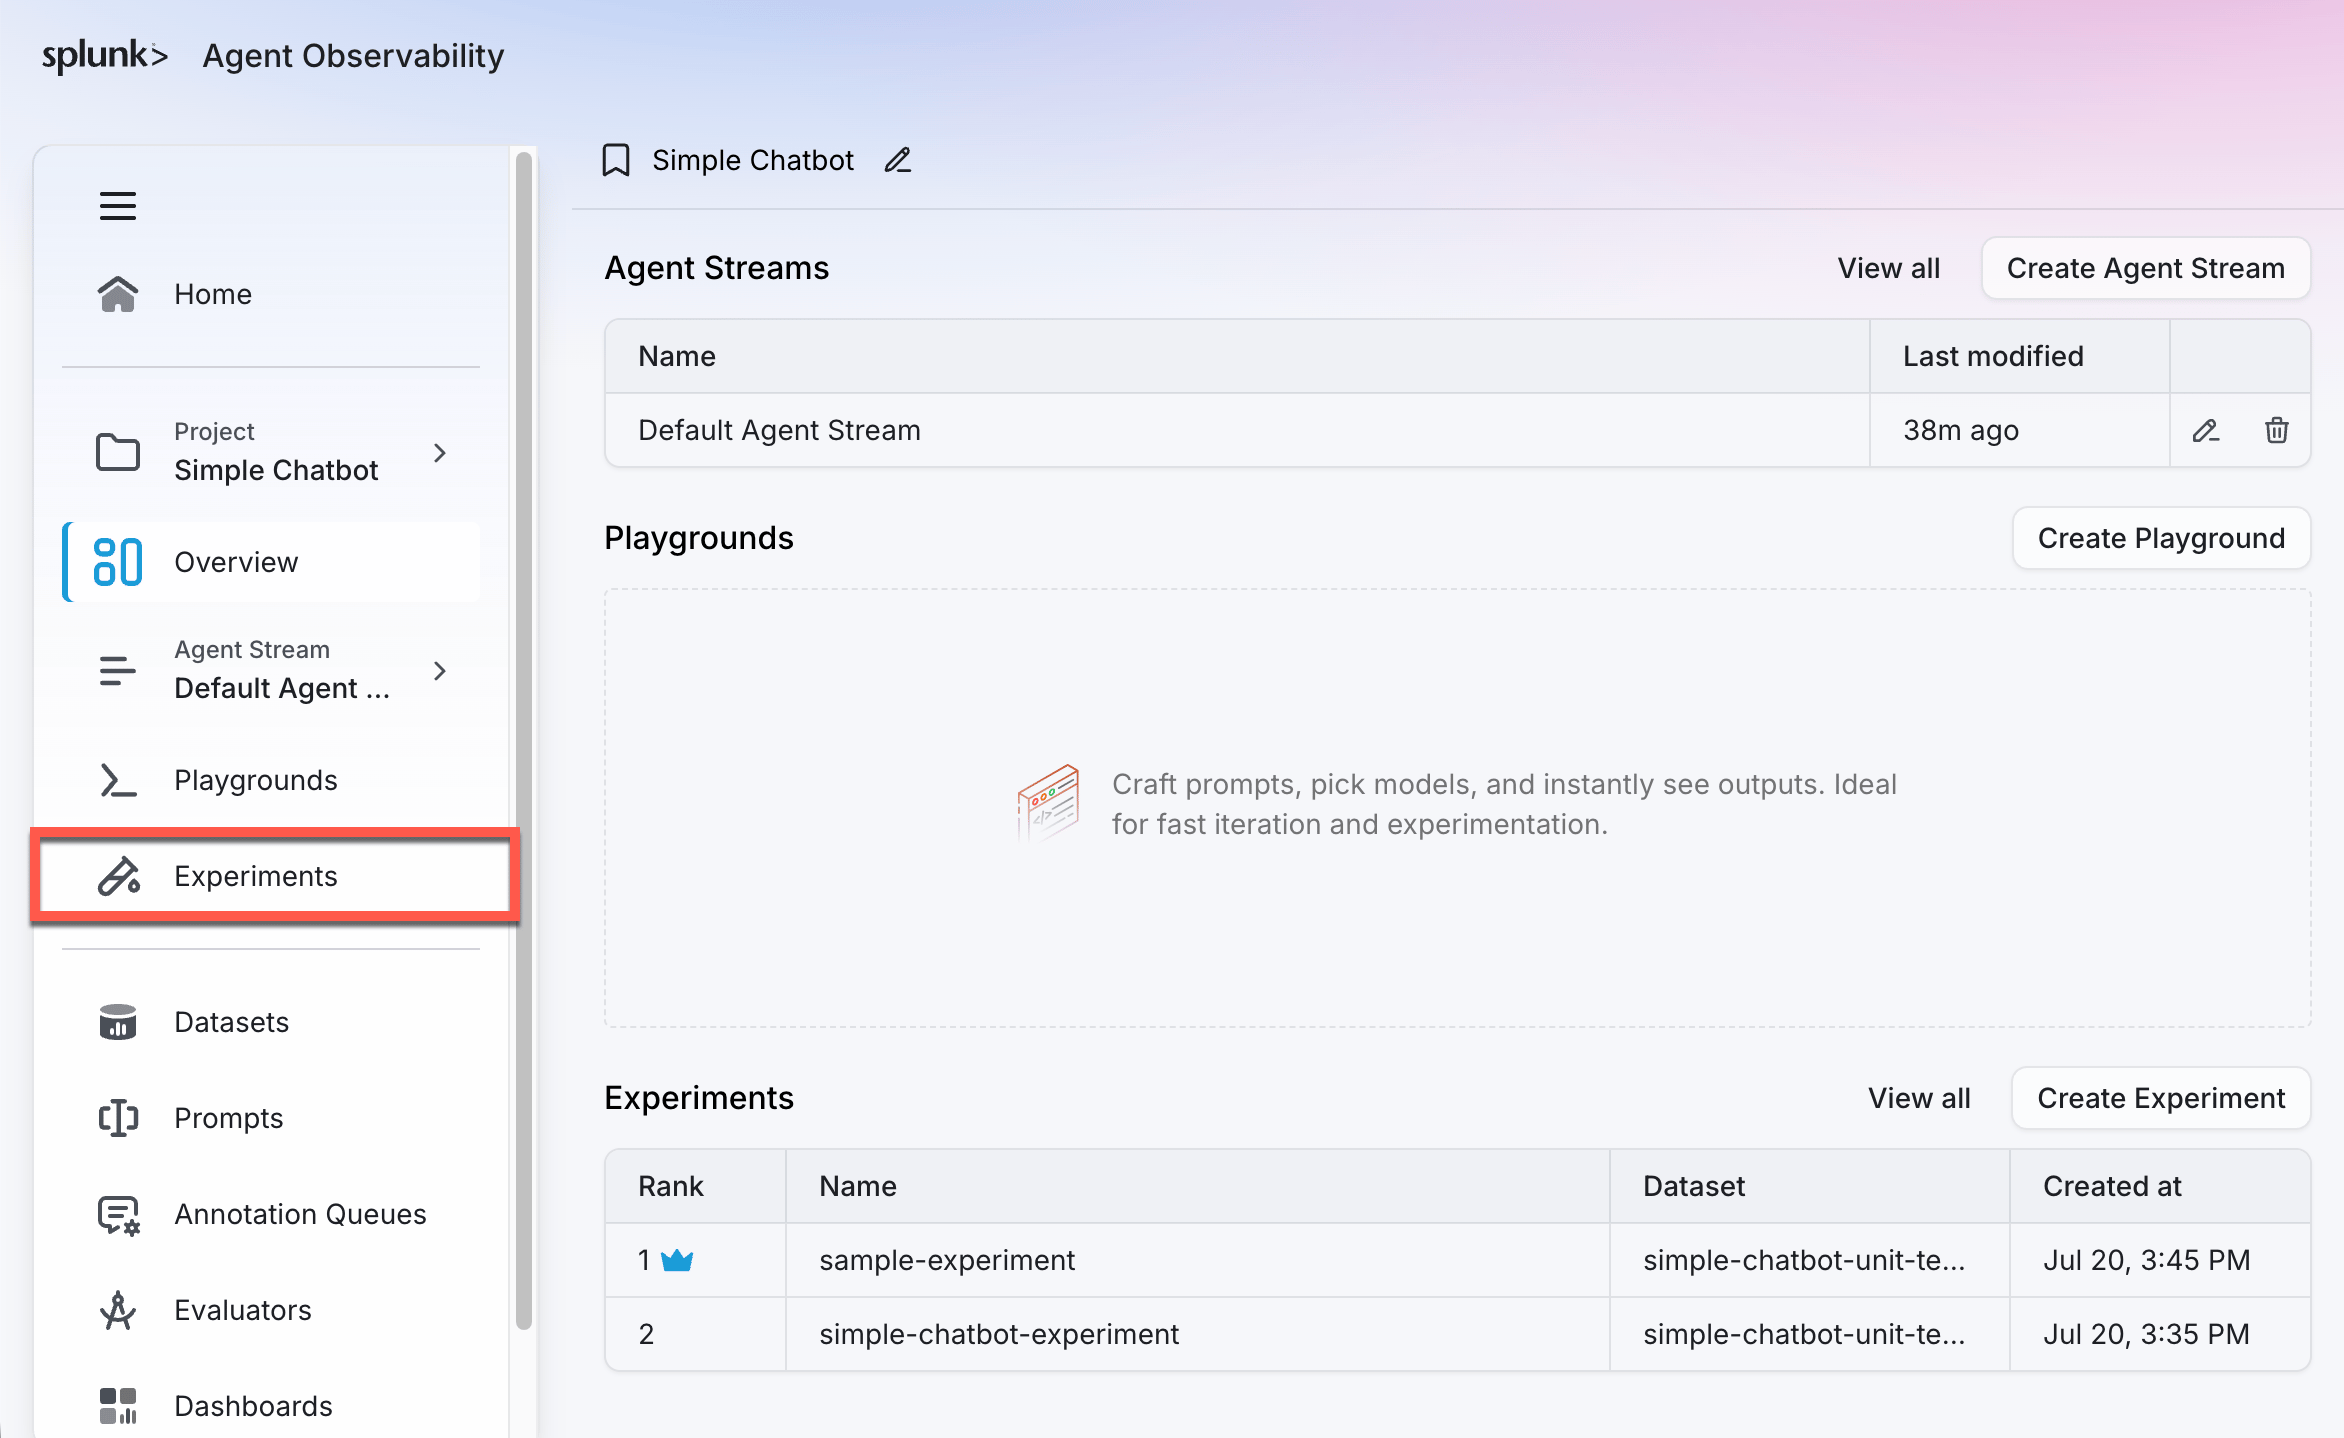
Experiments can be compared from the **Experiments** page in the Splunk Agent Observability UI. Experiments are part of a project, so select the relevant project and then select the **Experiments** page.
1. Use the main menu to select your project. Then, select **Experiments**.
 2. Select the experiments you want to compare by checking the box next to each experiment. Select between two and five experiments.
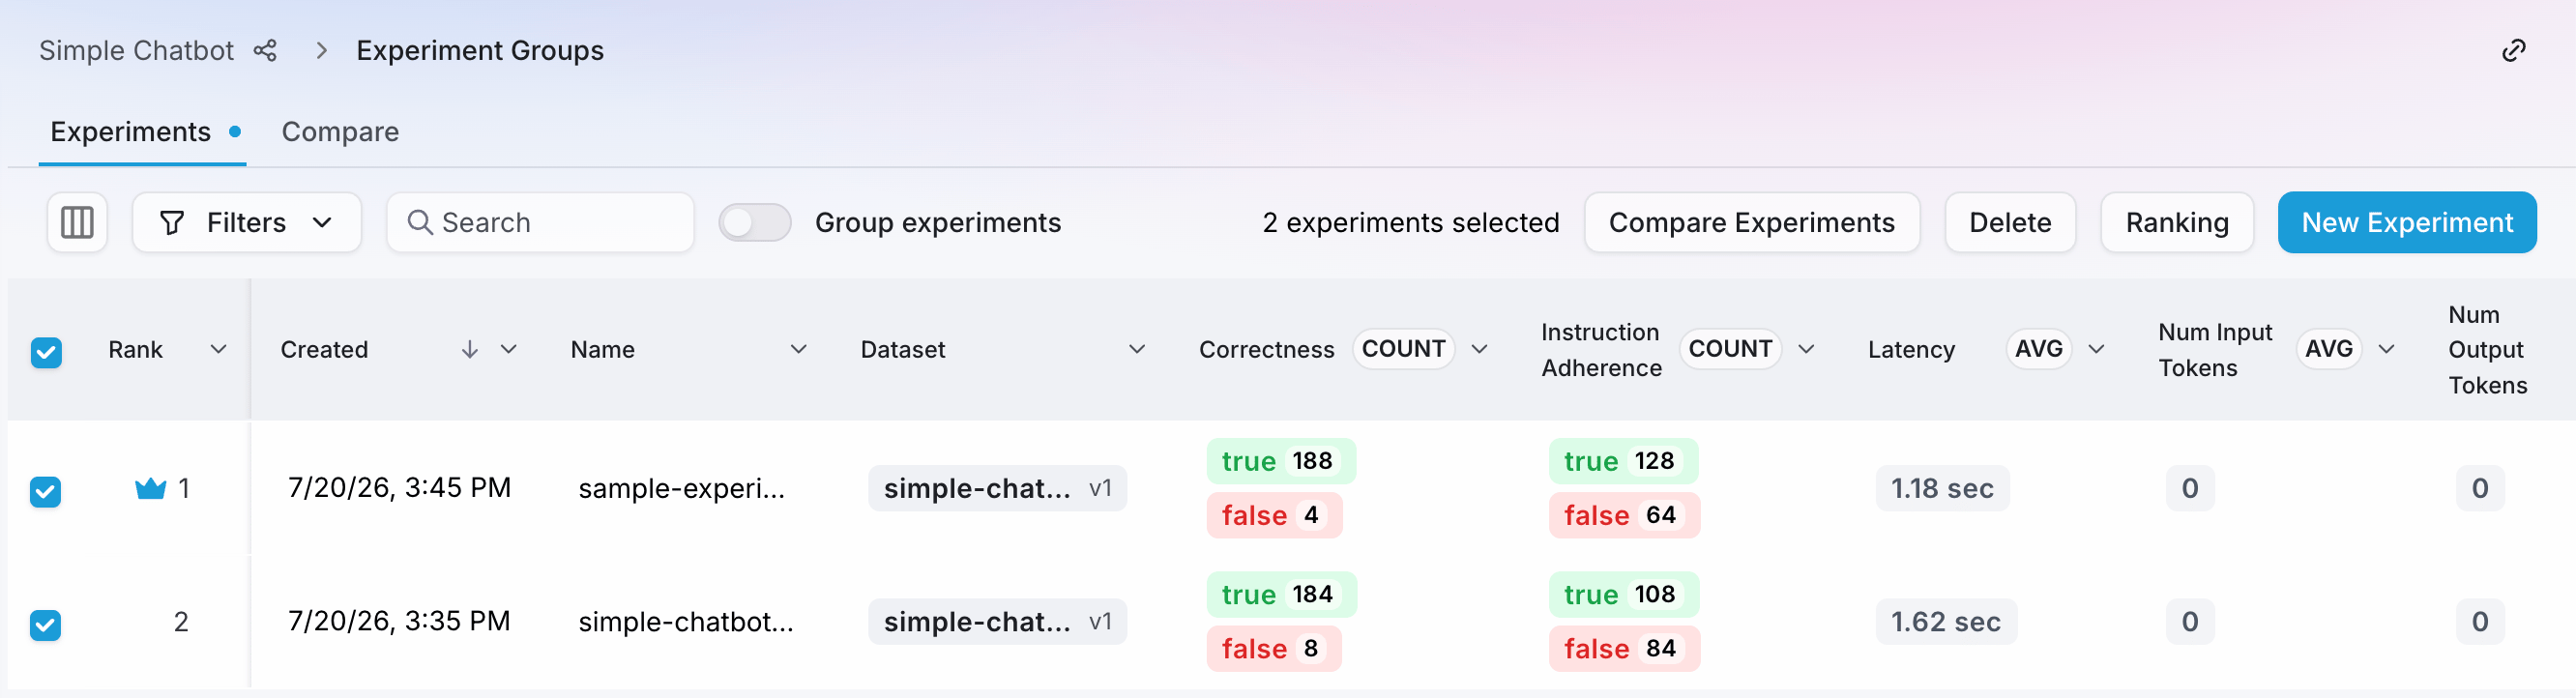 3. Select the **Compare experiments** button to open the comparison page
4. You will see the experiments side by side in the comparison page.
3. Select the **Compare experiments** button to open the comparison page
4. You will see the experiments side by side in the comparison page.
 ### Review the comparison
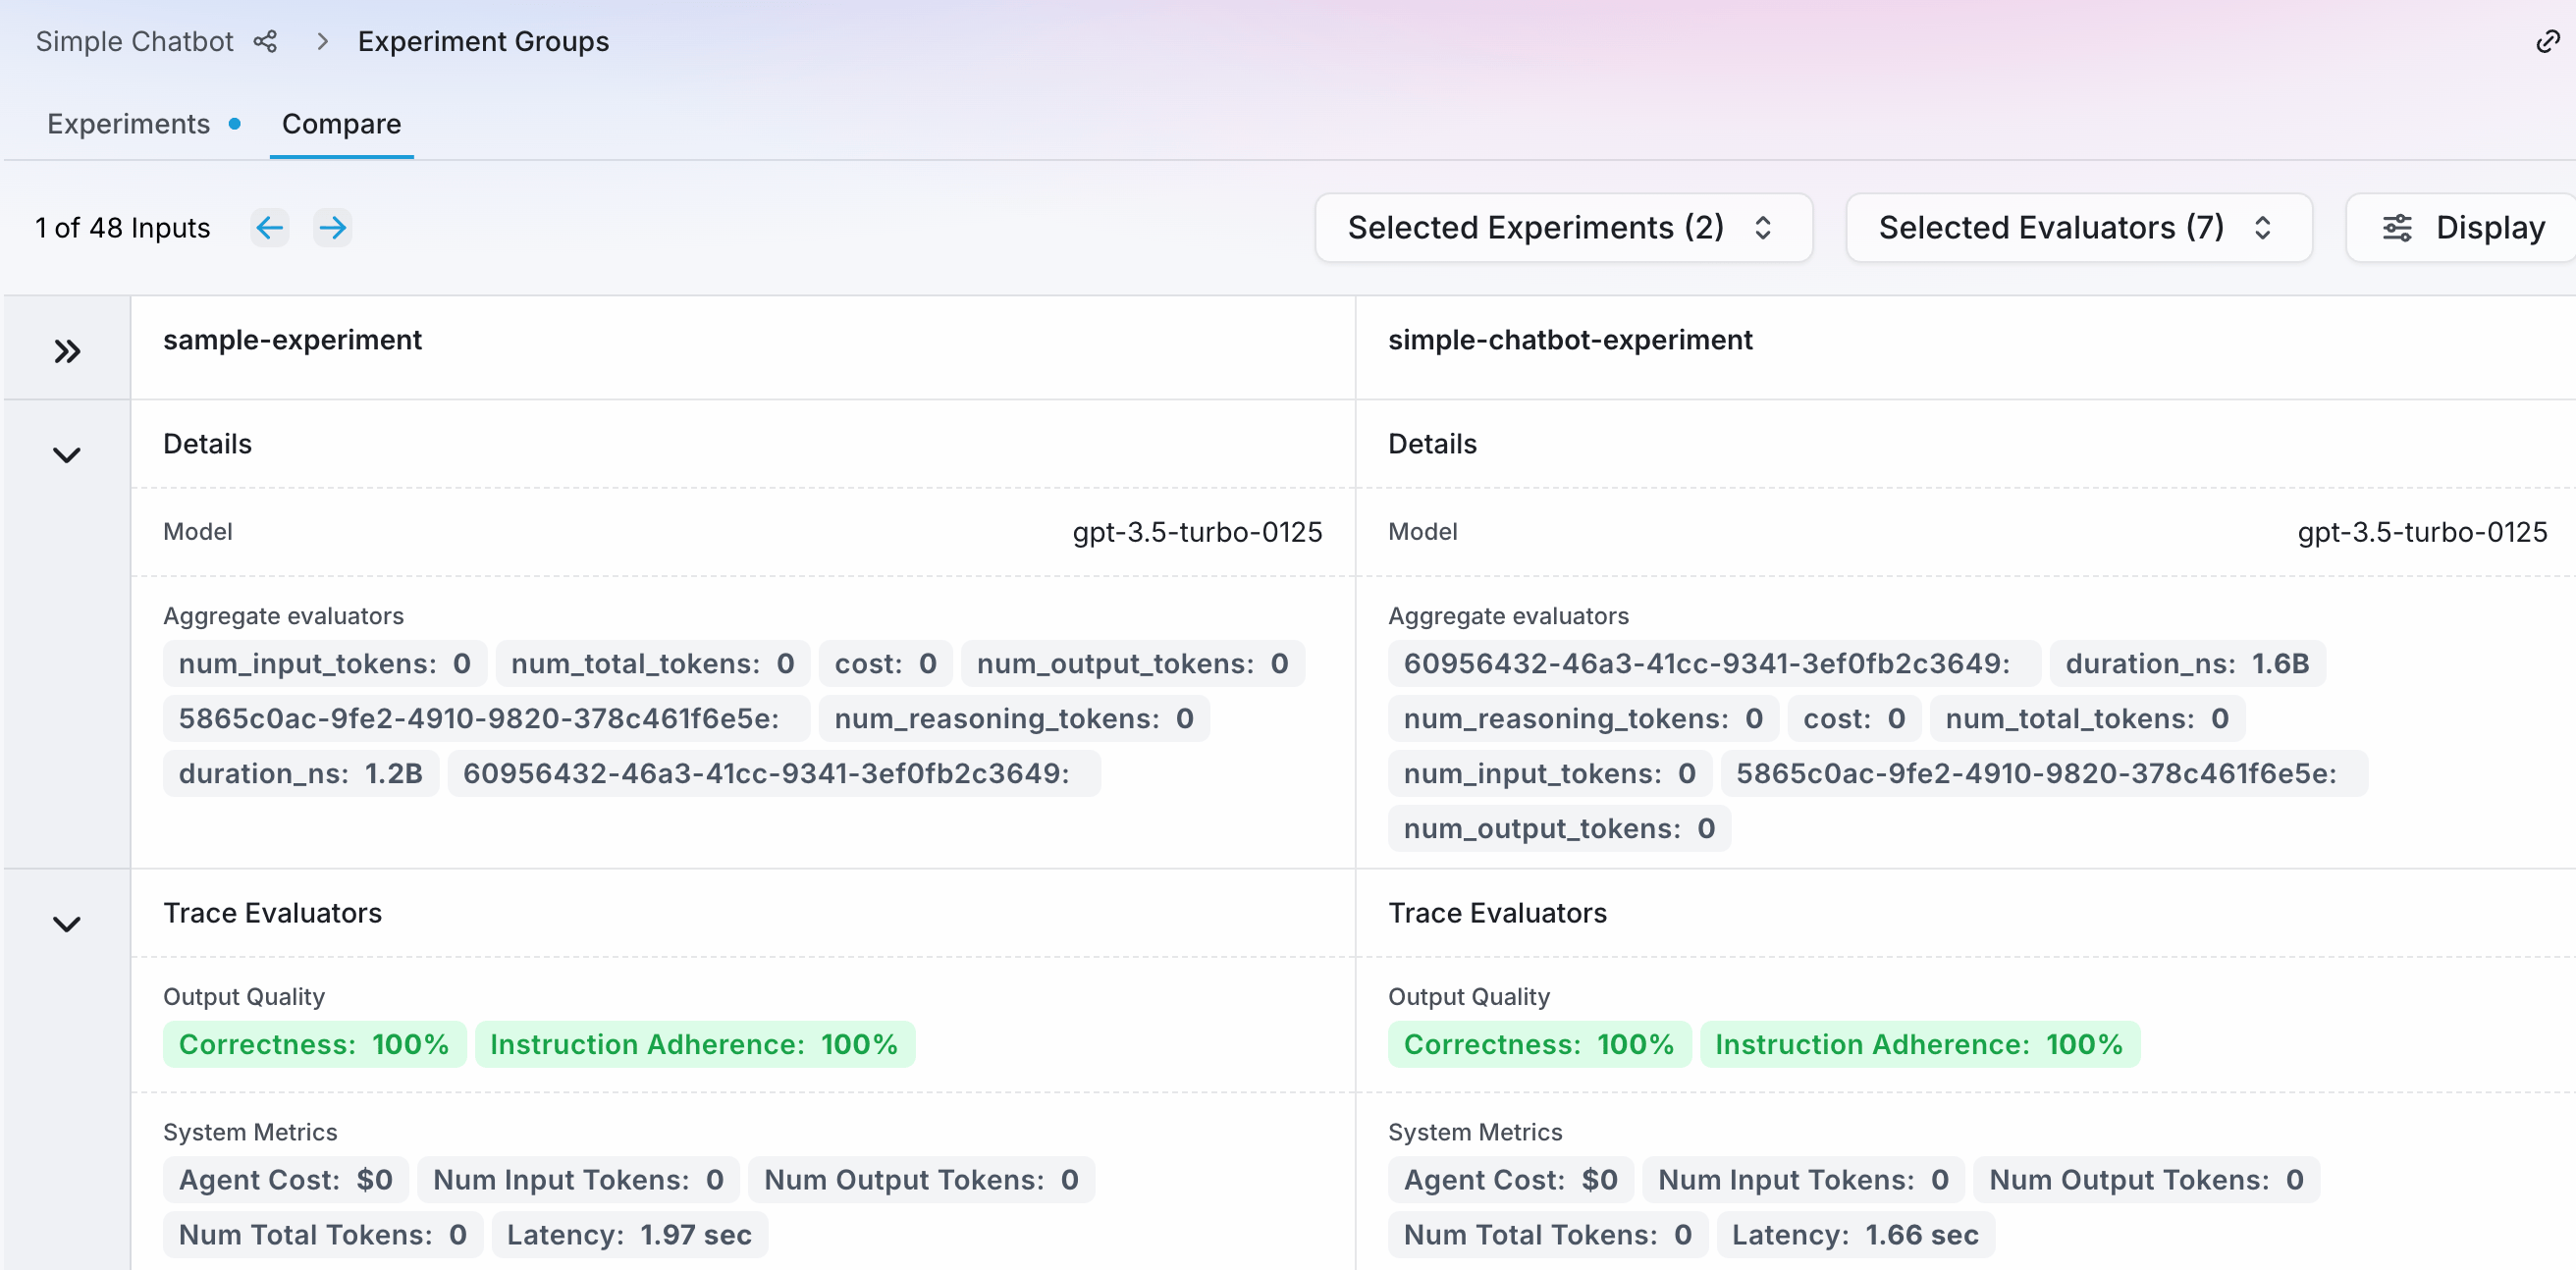
The comparison shows each experiment's evaluators, inputs, and outputs.
1. If your experiment has multiple inputs, you can navigate between inputs using the forward and backwards buttons. Your experiment inputs should align by position - for example if you have two inputs in each, the comparison is based on input one from experiment one being compared to input one from experiment two, and so on.
> All the experiments in the comparison should have the same number of inputs. If they do not, you will only be able to navigate based off of the experiment with the least inputs.
2. The **Details** section shows the model used, and averages and totals for both the cost of each response and generating the evaluators, as well as averages for the evaluators. Averages are calculated for experiments with multiple inputs.
3. The **Trace Evaluators** section shows the evaluators for the currently selected input. These evaluators include system evaluators (latency, the number of input and output tokens), and the selected evaluators for the experiment.
4. The **Input** and **Output** sections show the input to the experiment, and the output generated by the LLM.
### Review the comparison
The comparison shows each experiment's evaluators, inputs, and outputs.
1. If your experiment has multiple inputs, you can navigate between inputs using the forward and backwards buttons. Your experiment inputs should align by position - for example if you have two inputs in each, the comparison is based on input one from experiment one being compared to input one from experiment two, and so on.
> All the experiments in the comparison should have the same number of inputs. If they do not, you will only be able to navigate based off of the experiment with the least inputs.
2. The **Details** section shows the model used, and averages and totals for both the cost of each response and generating the evaluators, as well as averages for the evaluators. Averages are calculated for experiments with multiple inputs.
3. The **Trace Evaluators** section shows the evaluators for the currently selected input. These evaluators include system evaluators (latency, the number of input and output tokens), and the selected evaluators for the experiment.
4. The **Input** and **Output** sections show the input to the experiment, and the output generated by the LLM.