> ## Documentation Index
> Fetch the complete documentation index at: https://agent-observability-docs.splunk.com/llms.txt
> Use this file to discover all available pages before exploring further.
# Sessions Overview
> Learn about log sessions in Splunk Agent Observability
export const DefinitionCard = ({children}) => {
return
{children}
;
};
A Session is **a collection of Traces, Events, and Spans emitted by your Application**. They group all Traces for one conversation or evaluation run, giving you a bird's-eye view of that LLM workflow.
Imagine you're building an LLM-powered customer service chat application. During development or in production, you will want to see how a multi-turn conversation flows from user prompt, to tool calling, to model response. **Sessions** solve this problem by bundling Agent Stream traces into a cohesive unit, so you can observe and evaluate an entire agent interaction from start to finish.
## Core concepts
Let's take a look at the building blocks of a session.
### Span → trace → session
* [**Span**](/sdk-api/logging/splunk-ao-logger#add-spans): The smallest logging unit the system, typically representing a single operation, function call, or request. Each user message, model API call, or model tool usage generates a *Span*.
* [**Trace**](/sdk-api/logging/splunk-ao-logger#start-a-trace): When multiple spans occur as part of a single logical operation (e.g. a request that triggers several downstream calls) they form a *Trace*. Traces allow you to see parent/child relationships among spans.
* **Session**: A collection of one or more traces that together represent an entire interaction, or multi-step evaluation. A Session bundles related traces so that you can analyze an entire workflow end to end, even if it spans multiple services, threads, or agents.
## How do sessions differ from Agent Streams?
An [**Agent Stream**](/sdk-api/logging/logging-basics) is a continuous sequence of log entries emitted over time. Agent Streams simply capture everything in chronological order, and can contain a mix of spans, traces, and sessions.
On the other hand, a *Session* is a way to group Traces that are logically connected. And with Splunk Agent Observability, every Session is stored in an Agent Stream that you can specify either explicitly or using environment variables.
## How do sessions differ from workflows?
A **Workflow** is a defined sequence of steps or tasks. It may include branching logic, conditional steps, and dependencies.
A *Session* can contain one or more *Workflows* if they are part of the same overall evaluation.
## Where can I find my sessions?
Sessions can be viewed in the [Splunk Agent Observability UI](/concepts/logging/sessions/using-sessions#view-your-session). When you create a session, you will usually select an Agent Stream where they will be found. (If you don't specify one, Splunk Agent Observability will use your default Agent Stream).
Log into Splunk Agent Observability. Use the main menu to select a project, then select the Agent Stream where you were sending your session logs. If you didn't specify a unique or new Agent Stream name, you will find the logs in your **default** Agent Stream.
Selecting the Agent Stream will bring you to its event records. By default, all records will be grouped by *Sessions*. You can select the **Sessions**, **Traces**, or **Spans** tabs to change the event grouping.
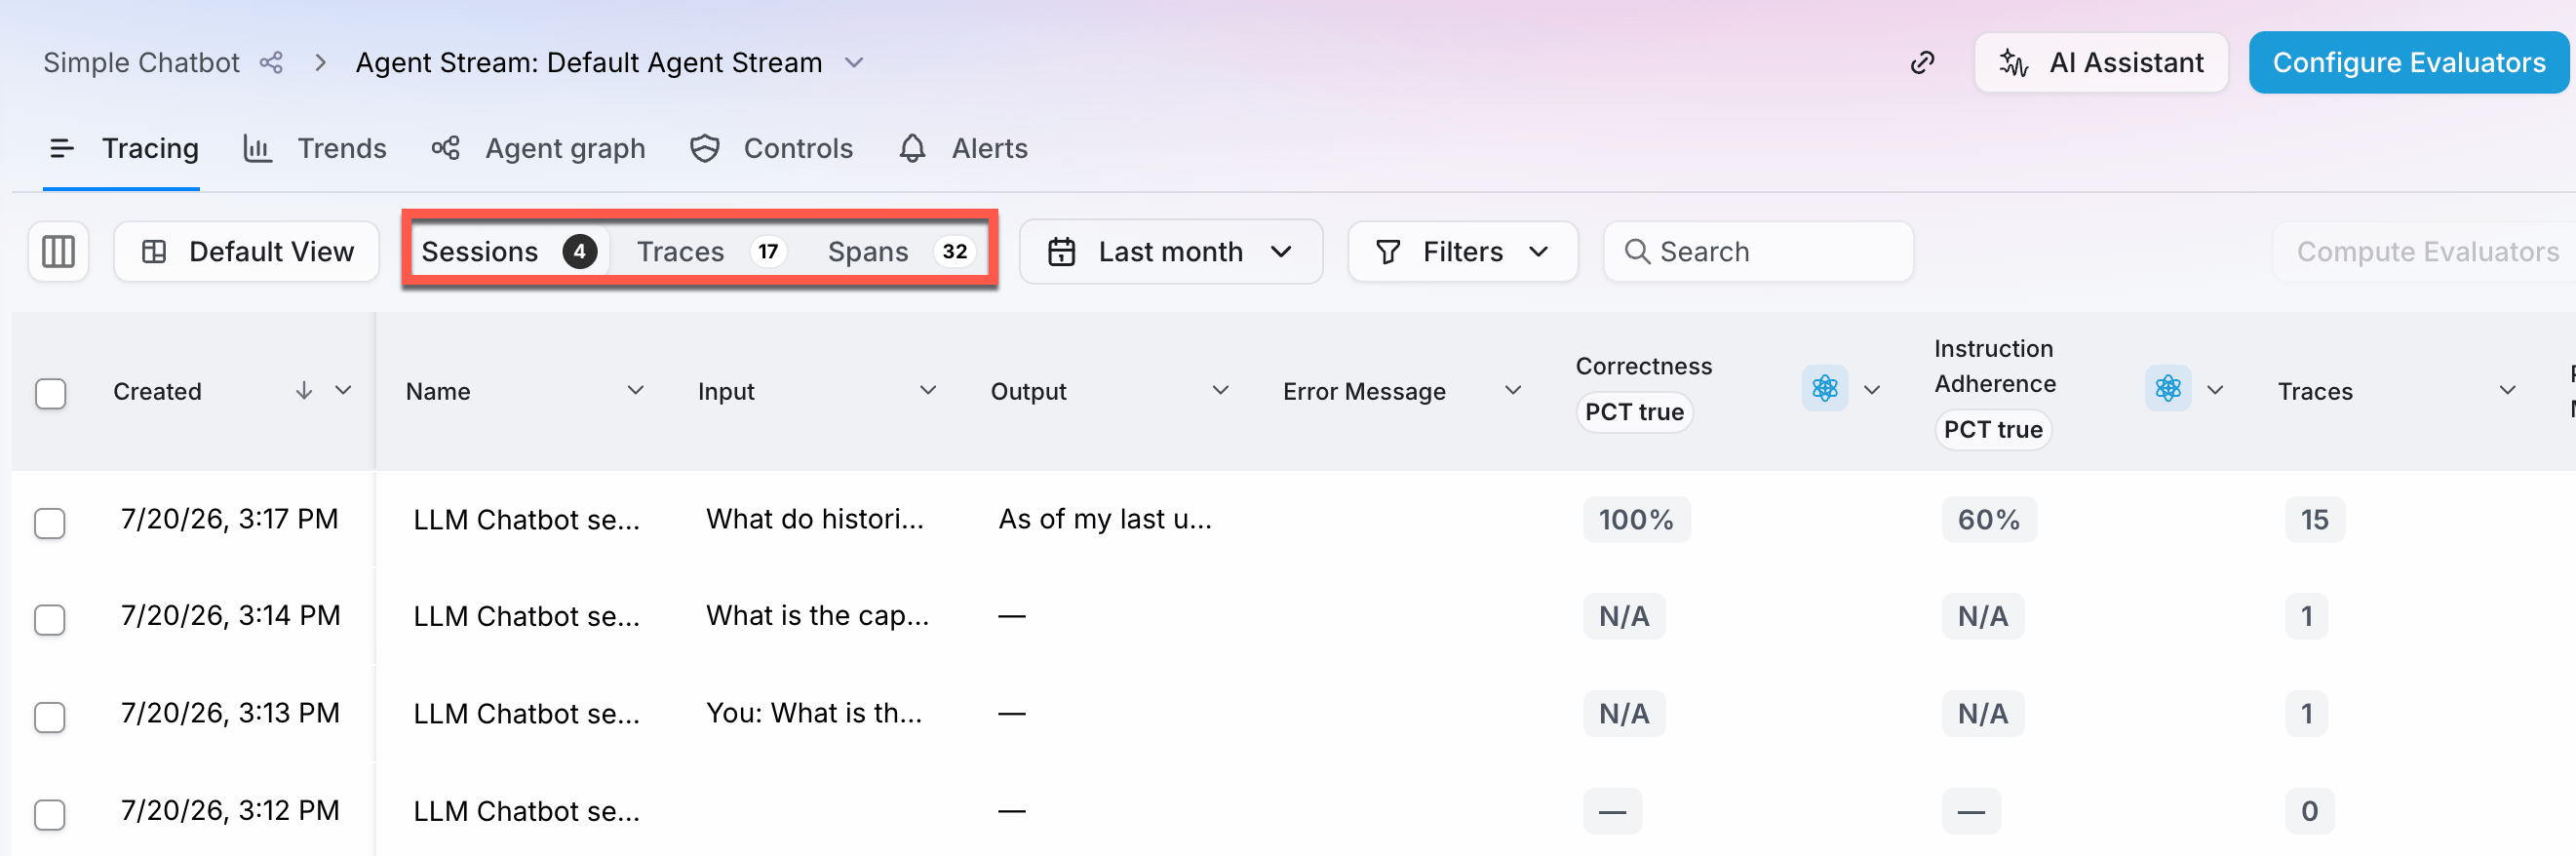 Your session should be visible in the table below the controls, especially if you gave it a recognizable name. Select it to view the traces.
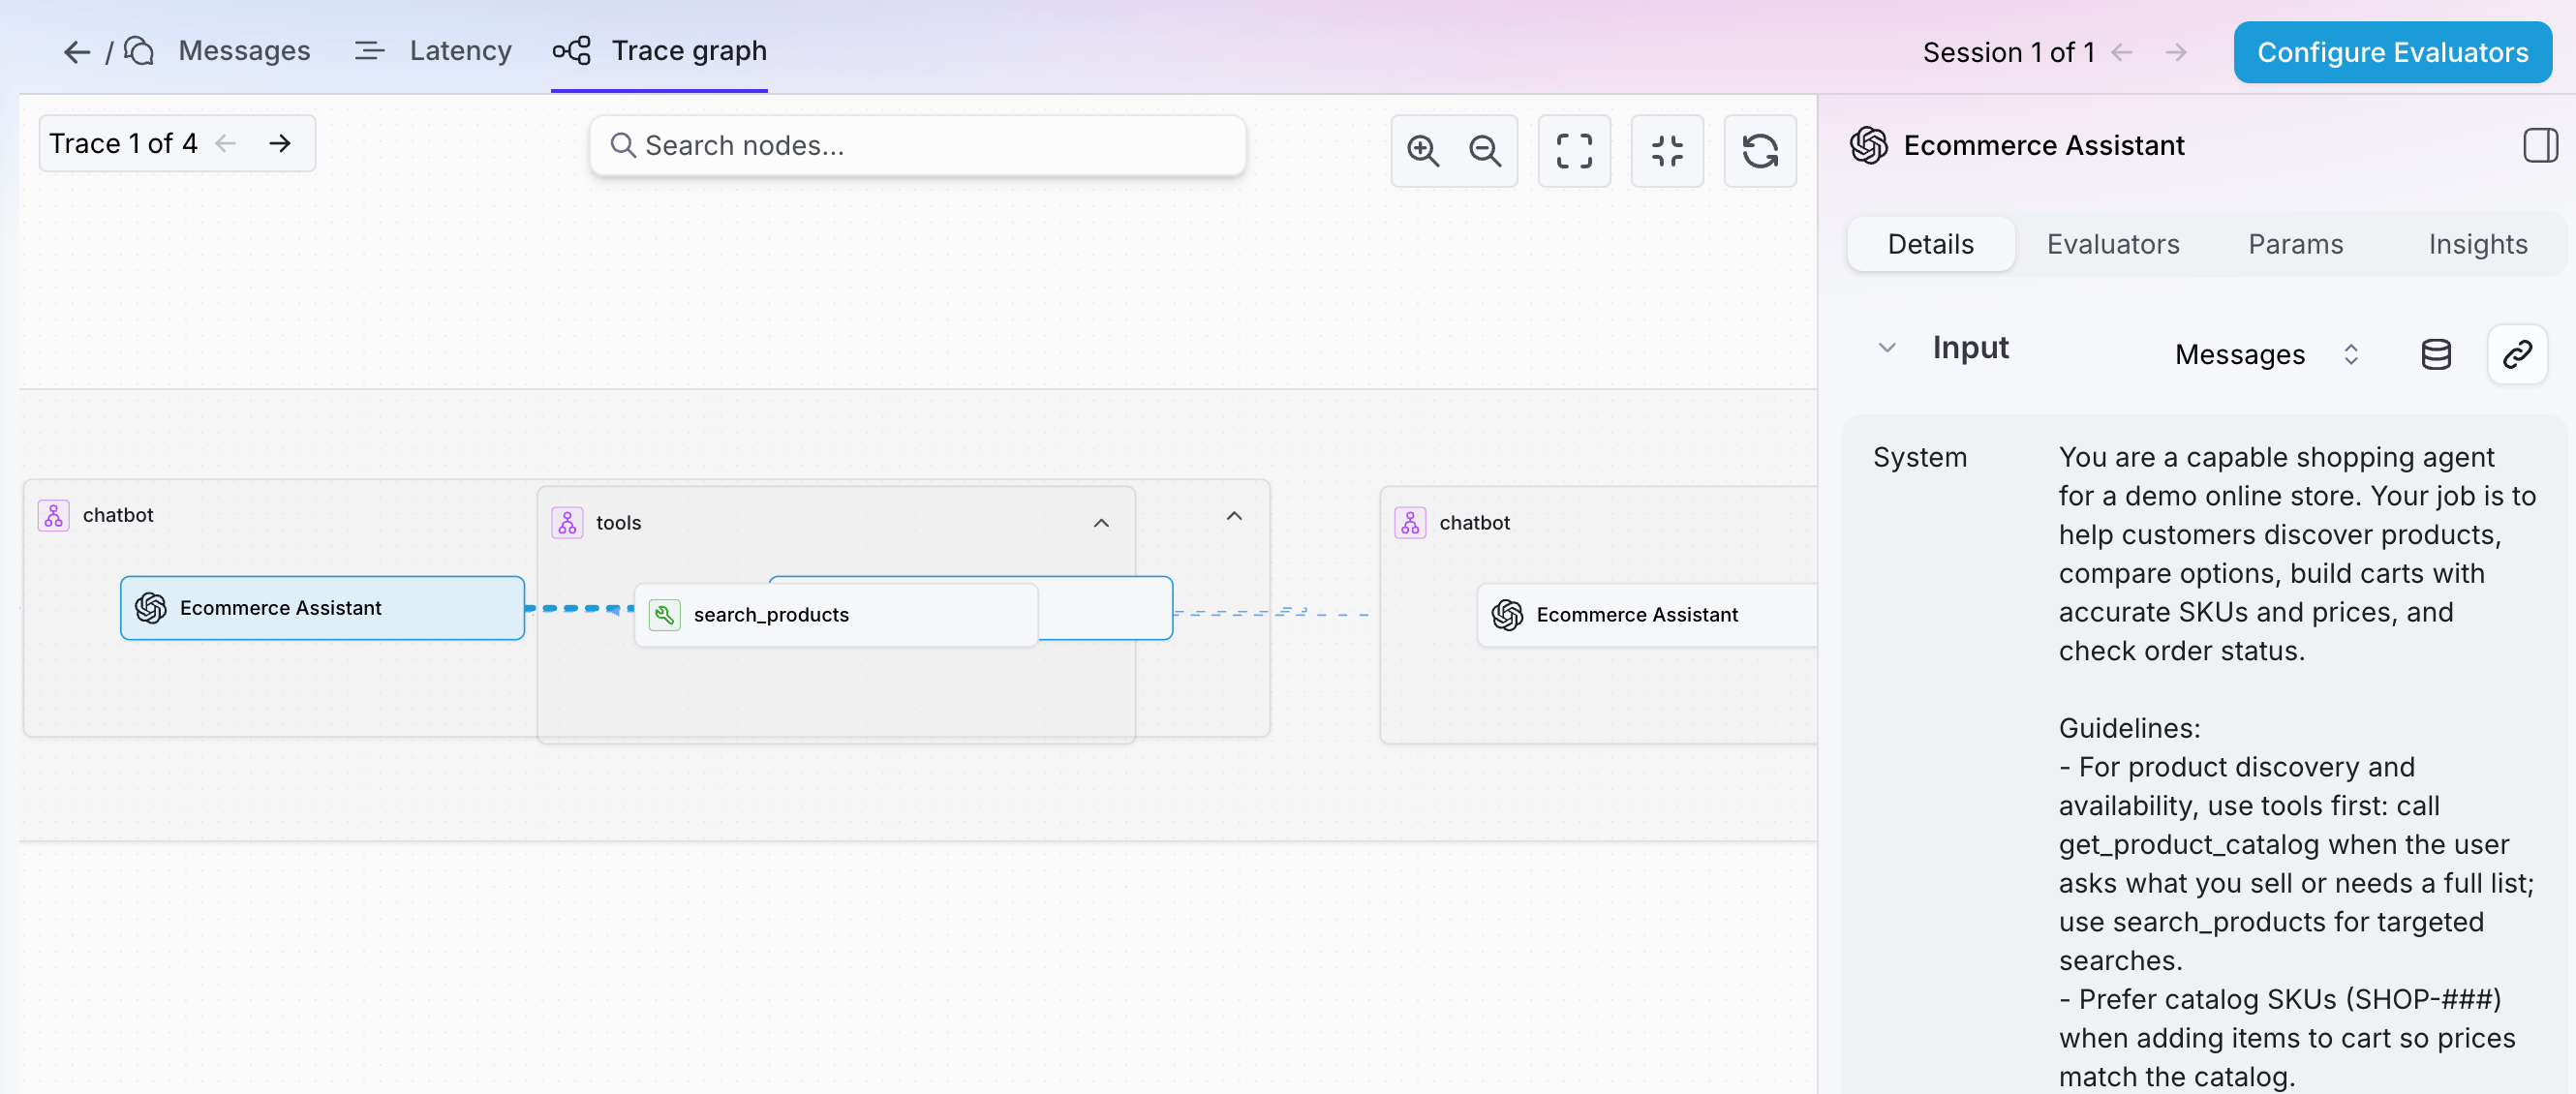
Once you select your session, select the **Trace graph** tab to see the Traces you captured from your test run as a flowchart. Any tools that were used will also show up as individual Spans.
Select the nodes of the flowchart to see their inputs and outputs on your screen.
Your session should be visible in the table below the controls, especially if you gave it a recognizable name. Select it to view the traces.
Once you select your session, select the **Trace graph** tab to see the Traces you captured from your test run as a flowchart. Any tools that were used will also show up as individual Spans.
Select the nodes of the flowchart to see their inputs and outputs on your screen.
 Each message from the user and response from the LLM forms a single trace. You can view the contents here in a familiar format, as well as other details like tool calls. Select the **Messages** tab to see a list of traces in the session, along with their child spans. You can also select a span to see evaluators and other details on the right edge of the screen.
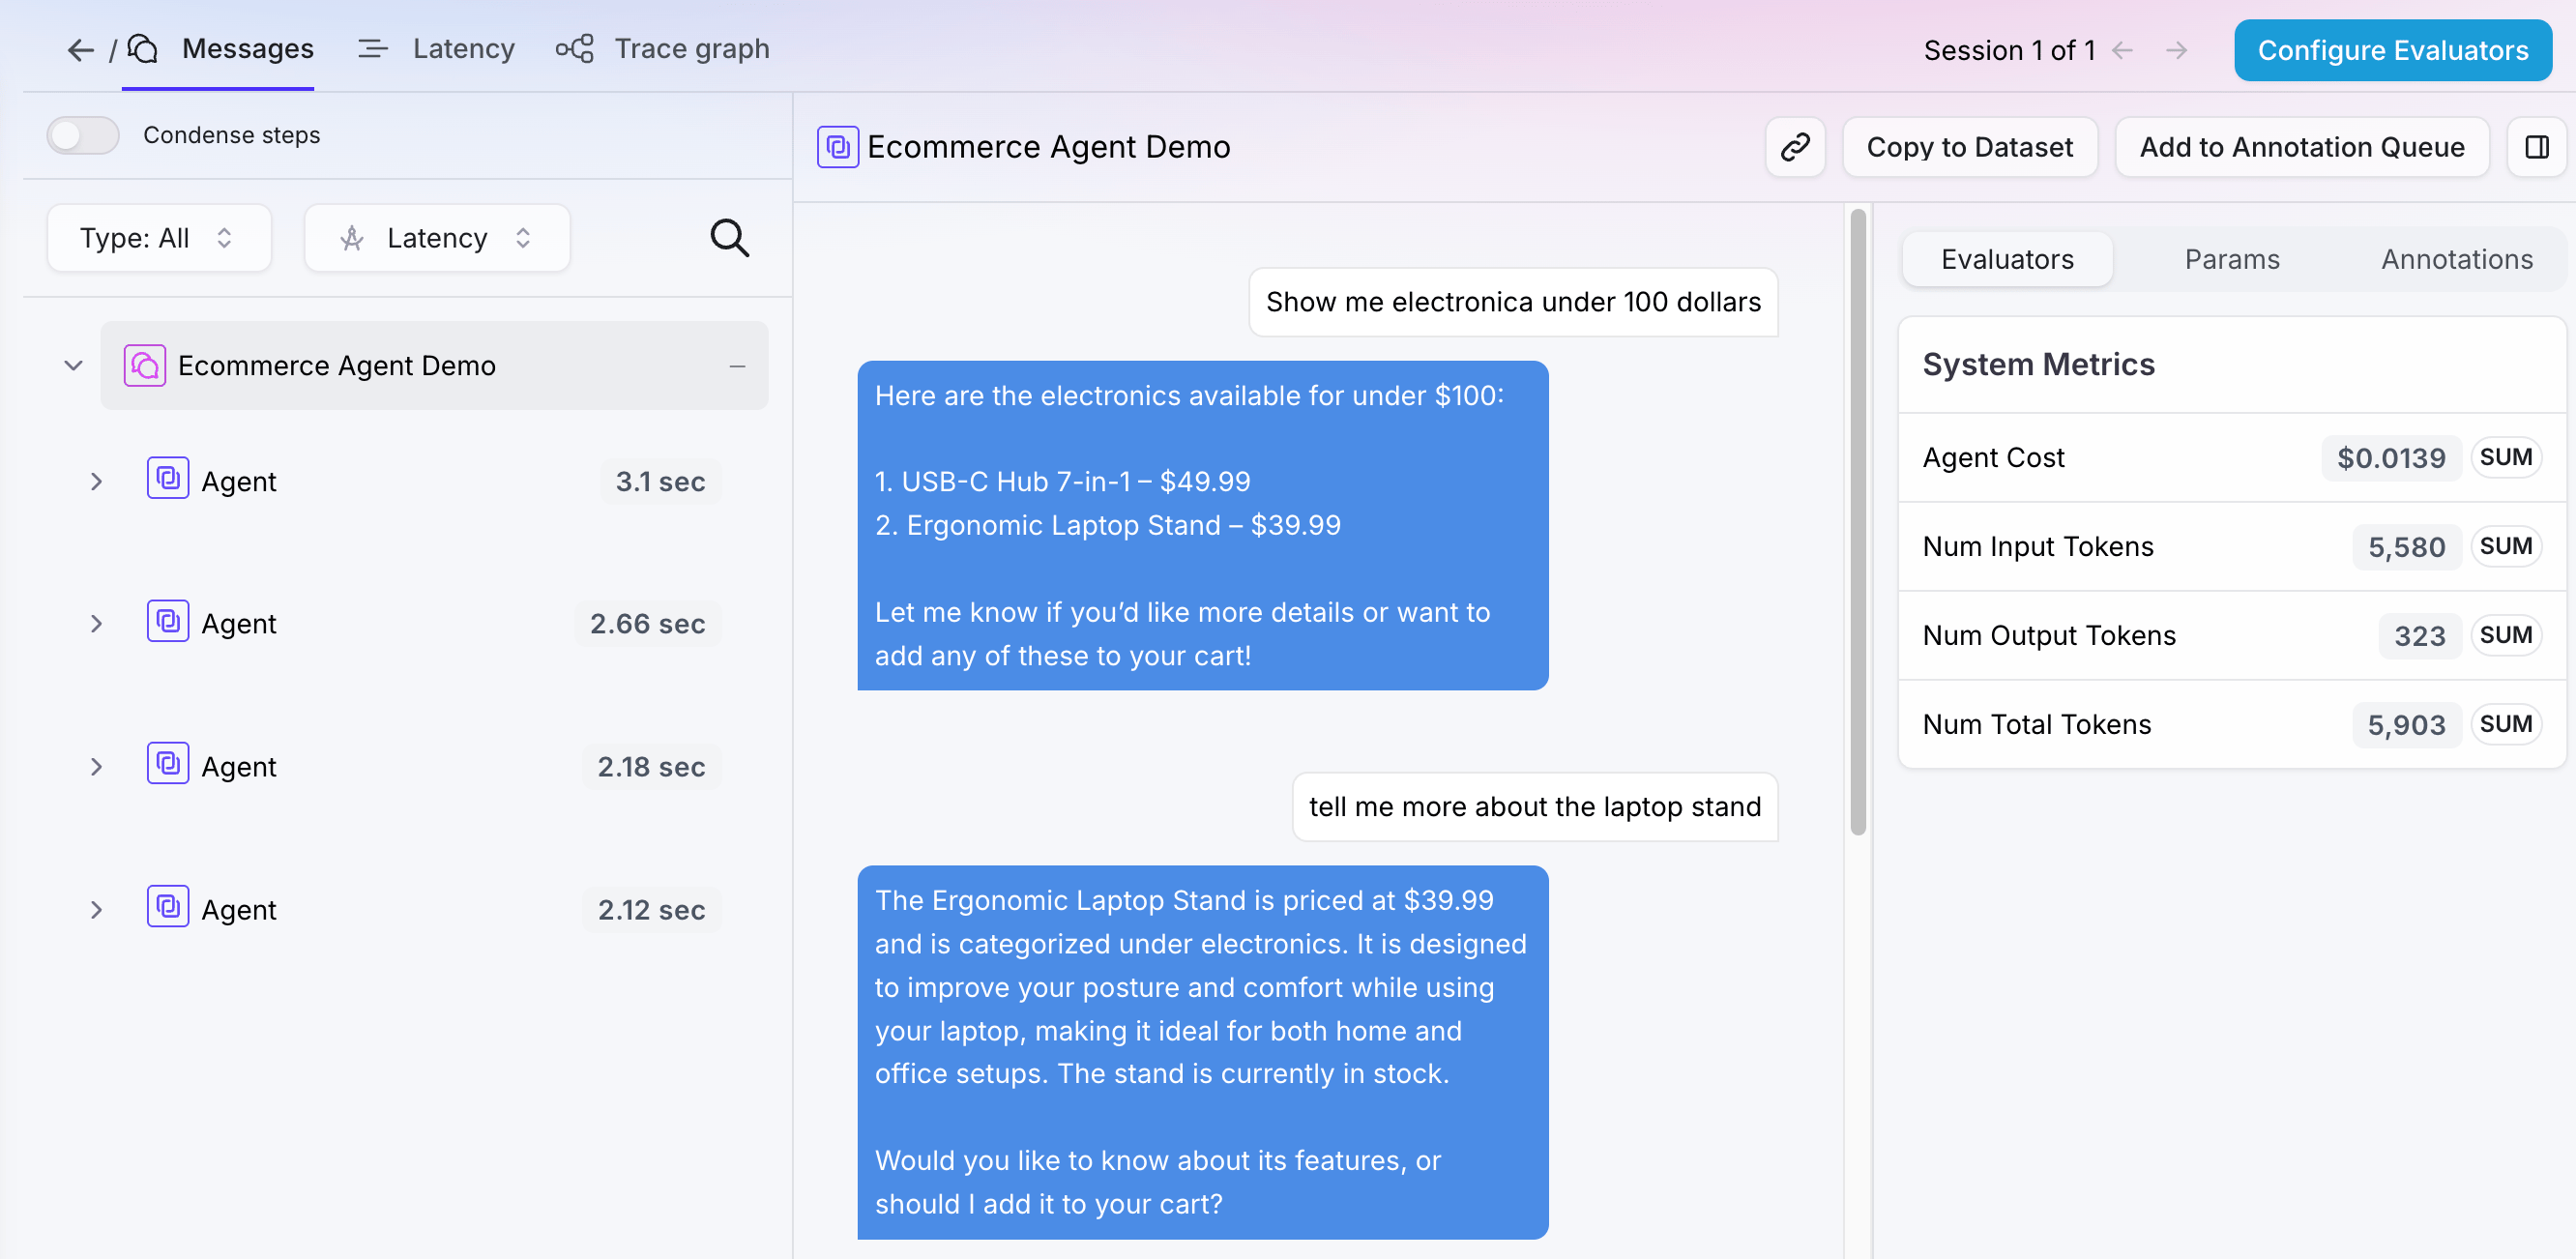 Use the **Condense Steps** toggle to show only the most relevant spans in a trace. This will include any tool calls made by the LLM!
You can learn more about creating and using sessions [in our using sessions guide](/concepts/logging/sessions/using-sessions).
## Conclusion
A Session can collect multiple workflow runs and traces into one cohesive view. By using Sessions in your LLM application, you can:
1. Organize logs and evaluators for each customer interaction or batch evaluation run, so debugging and analysis become straightforward.
2. Drill down into any step, inspecting the span for tokenization latency or the trace for scoring logic without losing context.
3. Compare multiple chat sessions to track performance improvements.
## Next steps
Learn how to [create and use sessions](/concepts/logging/sessions/using-sessions) in Splunk Agent Observability.
## Related resources
* [**Using Sessions**](/concepts/logging/sessions/using-sessions) - Create and view sessions in Splunk Agent Observability
* [**Agent Streams**](/sdk-api/logging/logging-basics) - Learn about Agent Streams in Splunk Agent Observability.
* [**Spans**](/sdk-api/logging/splunk-ao-logger#add-spans) - Learn about the building blocks of Traces in Splunk Agent Observability.
* [**Traces**](/sdk-api/logging/splunk-ao-logger#start-a-trace) - Learn about Traces, and different ways to create them.
Use the **Condense Steps** toggle to show only the most relevant spans in a trace. This will include any tool calls made by the LLM!
You can learn more about creating and using sessions [in our using sessions guide](/concepts/logging/sessions/using-sessions).
## Conclusion
A Session can collect multiple workflow runs and traces into one cohesive view. By using Sessions in your LLM application, you can:
1. Organize logs and evaluators for each customer interaction or batch evaluation run, so debugging and analysis become straightforward.
2. Drill down into any step, inspecting the span for tokenization latency or the trace for scoring logic without losing context.
3. Compare multiple chat sessions to track performance improvements.
## Next steps
Learn how to [create and use sessions](/concepts/logging/sessions/using-sessions) in Splunk Agent Observability.
## Related resources
* [**Using Sessions**](/concepts/logging/sessions/using-sessions) - Create and view sessions in Splunk Agent Observability
* [**Agent Streams**](/sdk-api/logging/logging-basics) - Learn about Agent Streams in Splunk Agent Observability.
* [**Spans**](/sdk-api/logging/splunk-ao-logger#add-spans) - Learn about the building blocks of Traces in Splunk Agent Observability.
* [**Traces**](/sdk-api/logging/splunk-ao-logger#start-a-trace) - Learn about Traces, and different ways to create them.