> ## Documentation Index
> Fetch the complete documentation index at: https://agent-observability-docs.splunk.com/llms.txt
> Use this file to discover all available pages before exploring further.
# Tags and Metadata
> Learn to use tags and metadata in Splunk Agent Observability logging and monitoring
Splunk Agent Observability’s **Tags and Metadata** feature enables teams to label, categorize, and organize model interactions in a structured way.
This structured labeling is essential for building reproducible, observable, and scalable evaluation workflows.
Tags and Metadata provide additional context to your logs and traces.
By adding Tags and Metadata to logged Sessions, Traces, and Spans, teams can:
* Track and compare experiments.
* View a clear timeline of how an agent’s behavior evolves across experiments.
* Track prompt versions and understand how version changes impact performance.
## Overview
**Tags** and **Metadata** are added to logged Sessions, Traces, and Spans.
**Tags** - short, flat labels (strings) you assign to a trace or span to make them easy to group and filter.
* Unlimited number of tags per trace/span (practical limit ≈ 50)
* Case-sensitive strings ≤ 50 chars each
* Ideal for boolean-style filters (e.g., “show me all traces tagged physics”)
**Metadata** - key-value dictionaries that travel with a Trace or a Span, perfect for structured information like user IDs, experiment hashes, timestamps, or numeric evaluators.
* Keys and values are strings ≤ 256 chars
* Appears in Agent Streams as new columns
* Ideal for structured attributes you can filter, group, and aggregate
## Add Tags and Metadata
> **Note:** This guide uses OpenAI as the example LLM. The code snippets are OpenAI-specific,
> especially in how the model response is handled (e.g., `response.choices[0].message.content`).
> If you are using a different LLM or following a different [Log Your First Trace](/getting-started/quickstart),
> the code will differ slightly—each LLM returns responses in its own format. Adjust the code as needed for your provider.
> Follow this step-by-step guide to get started using **Tags and Metadata** in your AI projects.
### Prerequisites
First, follow the [Log Your First Trace](/getting-started/quickstart) guide if you don't already have a Splunk Agent Observability Project set up.
Then, use the following steps to add Tags and Metadata to your logged Traces and Spans to your Project.
Open your Splunk Agent Observability application in your code editor.
In this guide, we are building on top of the **finished demo application** from the
[Log Your First Trace](/getting-started/quickstart) guide.
```python Python theme={null}
from datetime import datetime
from splunk_ao import splunk_ao_context
from splunk_ao import SplunkAOLogger
from splunk_ao.config import SplunkAOConfig
import openai
from dotenv import load_dotenv
# Load environment variables from the .env file
load_dotenv()
# Set the project and Agent Stream, these are created if they don't exist.
splunk_ao_context.init(project="MyFirstTagandMetadata",
agent_stream="MyFirstTagandMetatdata")
```
Create **descriptive tags and metadata** to be attached to your logs.
Both [Spans](/sdk-api/logging/splunk-ao-logger#add-spans) and
[Traces](/sdk-api/logging/splunk-ao-logger#start-a-trace)
can have their own tags and metadata. Define `tags` as a list of relevant labels,
and `metadata` as a dictionary of label types and their values.
The individual tag and metadata values must be strings.
> **Note:** The `answer` variable is set to the raw text output of the
> model so that it can be used later.
```python Python theme={null}
answer = response.choices[0].message.content.strip()
# Define tags and metadata
tags = ["newton", "test", "new-version"]
metadata = {"experimentNumber": "1",
"promptVersion": "0.0.1",
"field": "physics"}
```
Initialize logging by importing and calling the **Splunk Agent Observability Logger**.\
The **Project name** and **Agent Stream name** are used as inputs to
define in which Splunk Agent Observability Project and Agent Stream the logs will be created.\
After running our application, the logs will appear in the chosen
Project's Agent Stream in the Splunk Agent Observability UI.
```python Python theme={null}
# Include SplunkAOLogger in imports
from splunk_ao import SplunkAOLogger
...application code...
# Initialize logger
logger = SplunkAOLogger()
```
Initialize a new [Trace](/sdk-api/logging/splunk-ao-logger#start-a-trace)
to start listening for data to log.\
By using the `tags` and `metadata` inputs, important information is
added to the Trace.
```python Python theme={null}
# Initialize a new Trace and start listening for logs to add to it
trace = logger.start_trace(
input=prompt,
tags=tags,
metadata=metadata
)
```
Create a new [Span](/sdk-api/logging/splunk-ao-logger#add-spans) containing
the data created by running the LLM. By using the `tags` and `metadata` inputs,
important information is added to the Span.
> **Note:** In this guide, the tags and metadata used for the Span
> and the Trace are identical. But, they don't have to be. You can use
> different tags and metadata for Spans and the Traces they're attached to.
```python Python theme={null}
# Create a Span to log LLM outputs. This is captured by the Trace
logger.add_llm_span(
input=[{"role": "system", "content": prompt}],
output=response.choices[0].message.content,
model="gpt-4o",
tags=tags,
metadata=metadata
)
```
To close the new Trace and **complete the logging session**,
we use `logger.conclude()` with the LLM's raw text output as the input.\
Then, `logger.flush()` pushes the logs to the selected
Project's [Agent Stream](/sdk-api/logging/logging-basics).
```python Python theme={null}
# Close the Trace and push captured logs to it
logger.conclude(answer)
logger.flush()
```
By adding each previous code snippet to your Splunk Agent Observability application,
it is ready to run and create tags and metadata logs.\
Below is the **final combined application code** for the
[Log Your First Trace](/getting-started/quickstart) demo application,
with our tags and metadata added to logged Traces and Spans.
```python Python theme={null}
from datetime import datetime
from splunk_ao import splunk_ao_context
from splunk_ao import SplunkAOLogger
from splunk_ao.config import SplunkAOConfig
import openai
from dotenv import load_dotenv
# Load environment variables from the .env file
load_dotenv()
# Set the project and Agent Stream, these are created if they don't exist.
# You can also set these using the SPLUNK_AO_PROJECT and SPLUNK_AO_AGENT_STREAM
# environment variables.
splunk_ao_context.init(project="MyFirstTagandMetadata",
agent_stream="MyFirstTagandMetatdata")
# Get the Splunk Agent Observability logger instance
logger = splunk_ao_context.get_logger_instance()
# Start a Splunk Agent Observability session
logger.start_session()
# Initialize the OpenAI client
client = openai.OpenAI()
# Define a system prompt with guidance
system_prompt = f"""
You are a helpful assistant that wants to provide a user as much
information as possible. Avoid saying I don't know.
"""
# Define a user prompt
user_prompt = f"Explain the following topic succinctly: Newton's First Law"
# Send a request to the LLM
response = client.chat.completions.create(
model="gpt-4o-mini",
messages=[
{"role": "system", "content": system_prompt},
{"role": "user", "content": user_prompt}
],
)
# Print the response
print(response.choices[0].message.content.strip())
answer = response.choices[0].message.content.strip()
# Define tags and metadata
tags = ["newton", "test", "new-version"]
metadata = {"experimentNumber": "1",
"promptVersion": "0.0.1",
"field": "physics"}
# Initialize a new Trace and start listening for logs to add to it
trace = logger.start_trace(
input=user_prompt,
tags=tags,
metadata=metadata
)
# Create a span to log LLM outputs. This is captured by the Trace.
logger.add_llm_span(
input=[{"role": "system", "content": user_prompt}],
output=response.choices[0].message.content,
model="gpt-4o",
tags=tags,
metadata=metadata,
)
# Close the Trace and push captured logs to it
logger.conclude(answer)
logger.flush()
# Show Splunk Agent Observability information after the response
config = SplunkAOConfig.get()
project_url = f"{config.console_url}project/{logger.project_id}"
agent_stream_url = f"{project_url}/agent-streams/{logger.agent_stream_id}"
print()
print("🚀 SPLUNK-AO LOG INFORMATION:")
print(f"🔗 Project : {project_url}")
print(f"📝 Agent Stream: {agent_stream_url}")
```
Run your Splunk Agent Observability application.\
If your application file is named `app`
(as in the [Log Your First Trace](/getting-started/quickstart) demo),
you can run it by using the following command in your terminal.
```bash Python theme={null}
python app.py
```
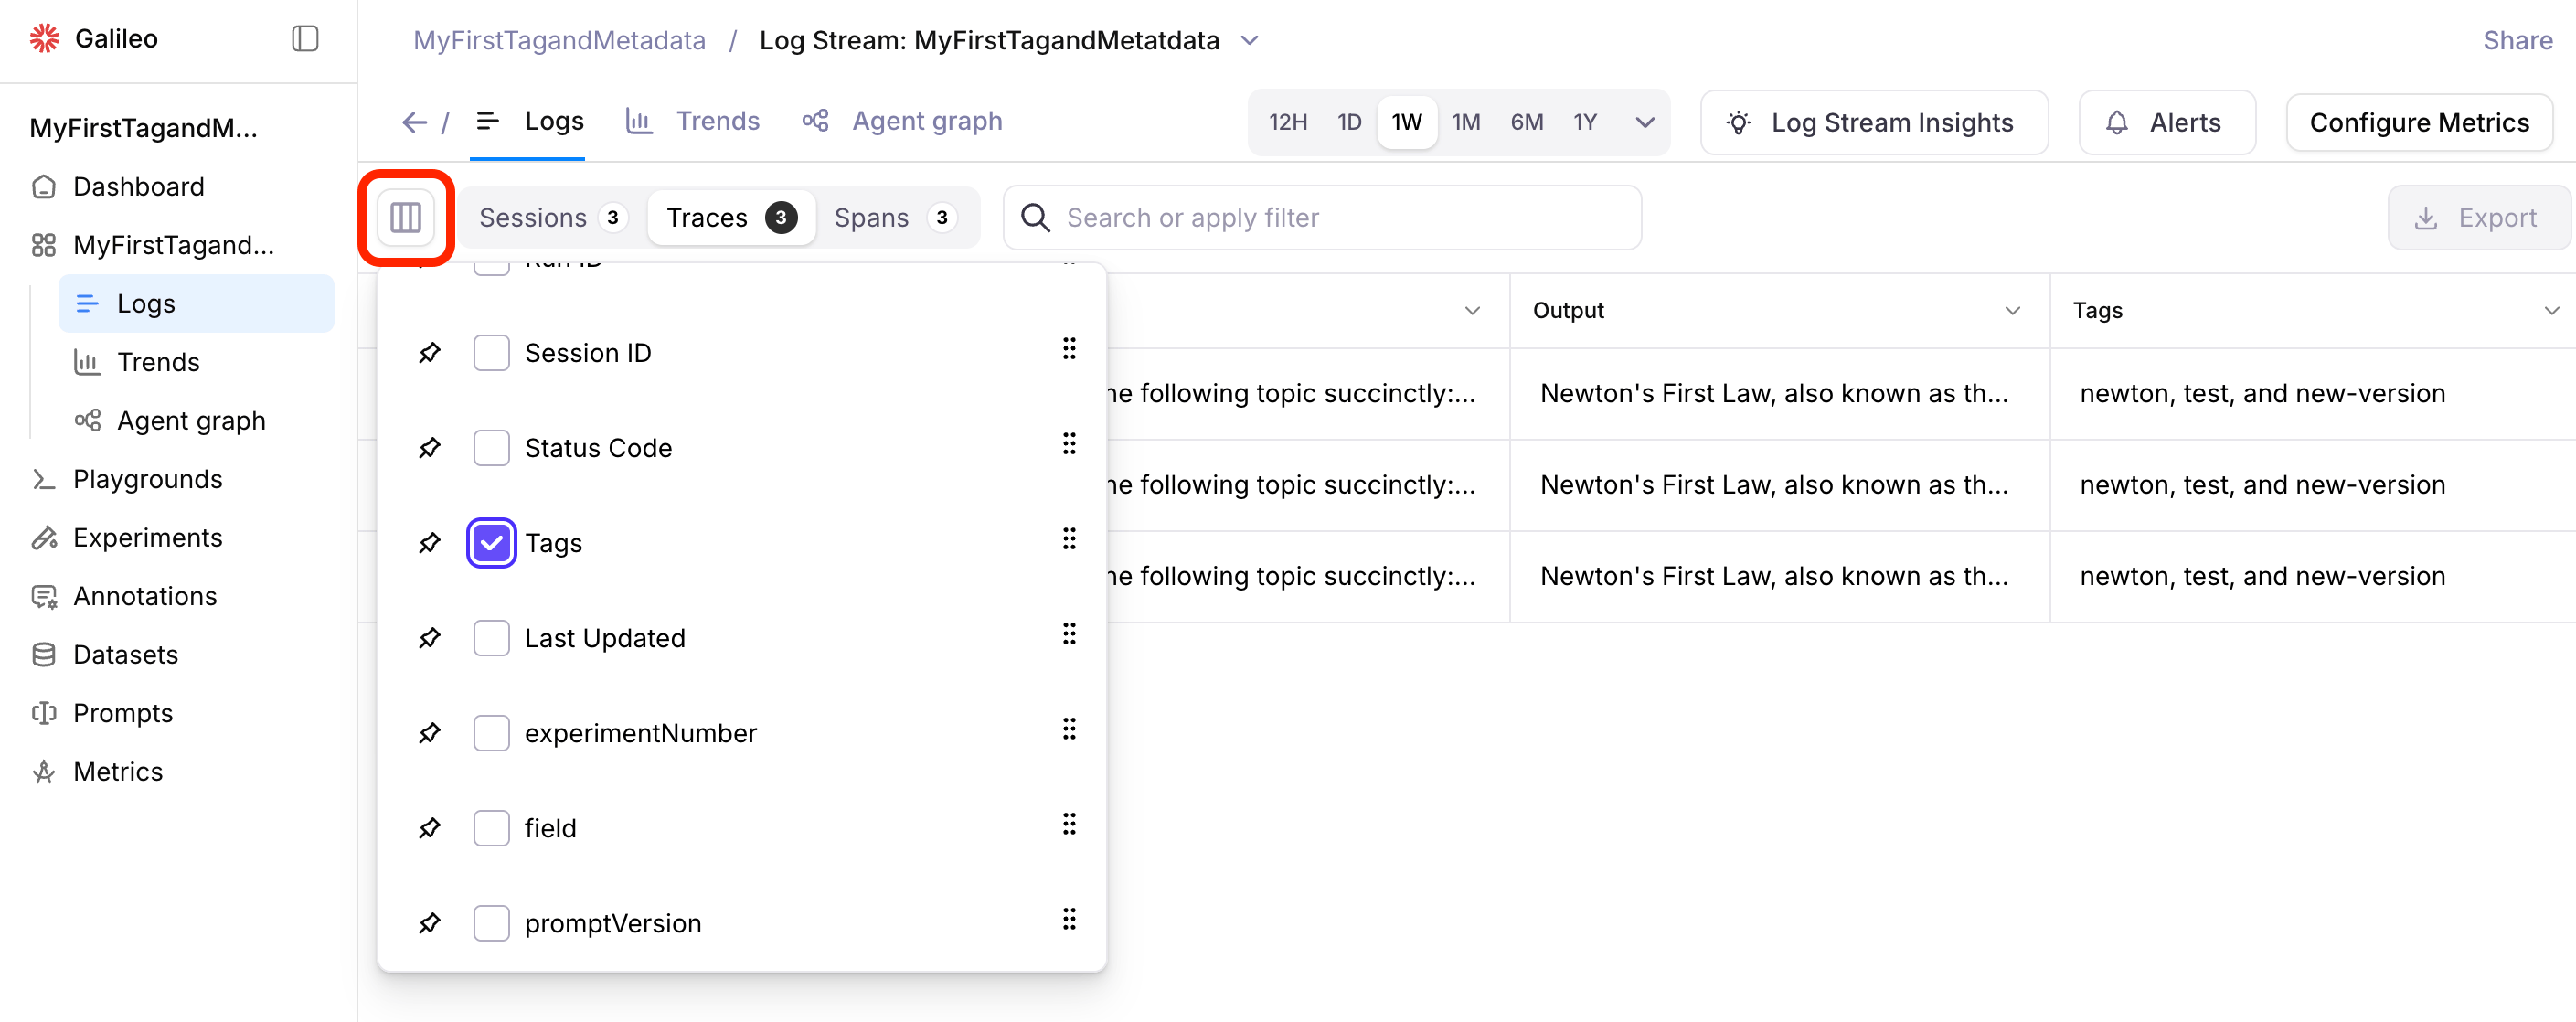
In the Splunk Agent Observability UI, select your Project
and Agent Stream in the top-left corner. For **each time you run your application**,
you will see a new Trace entry in your Agent Stream. Click the
column icon to open the column selector, and enable the tags and
metadata keys you created earlier to view them in the Trace table.
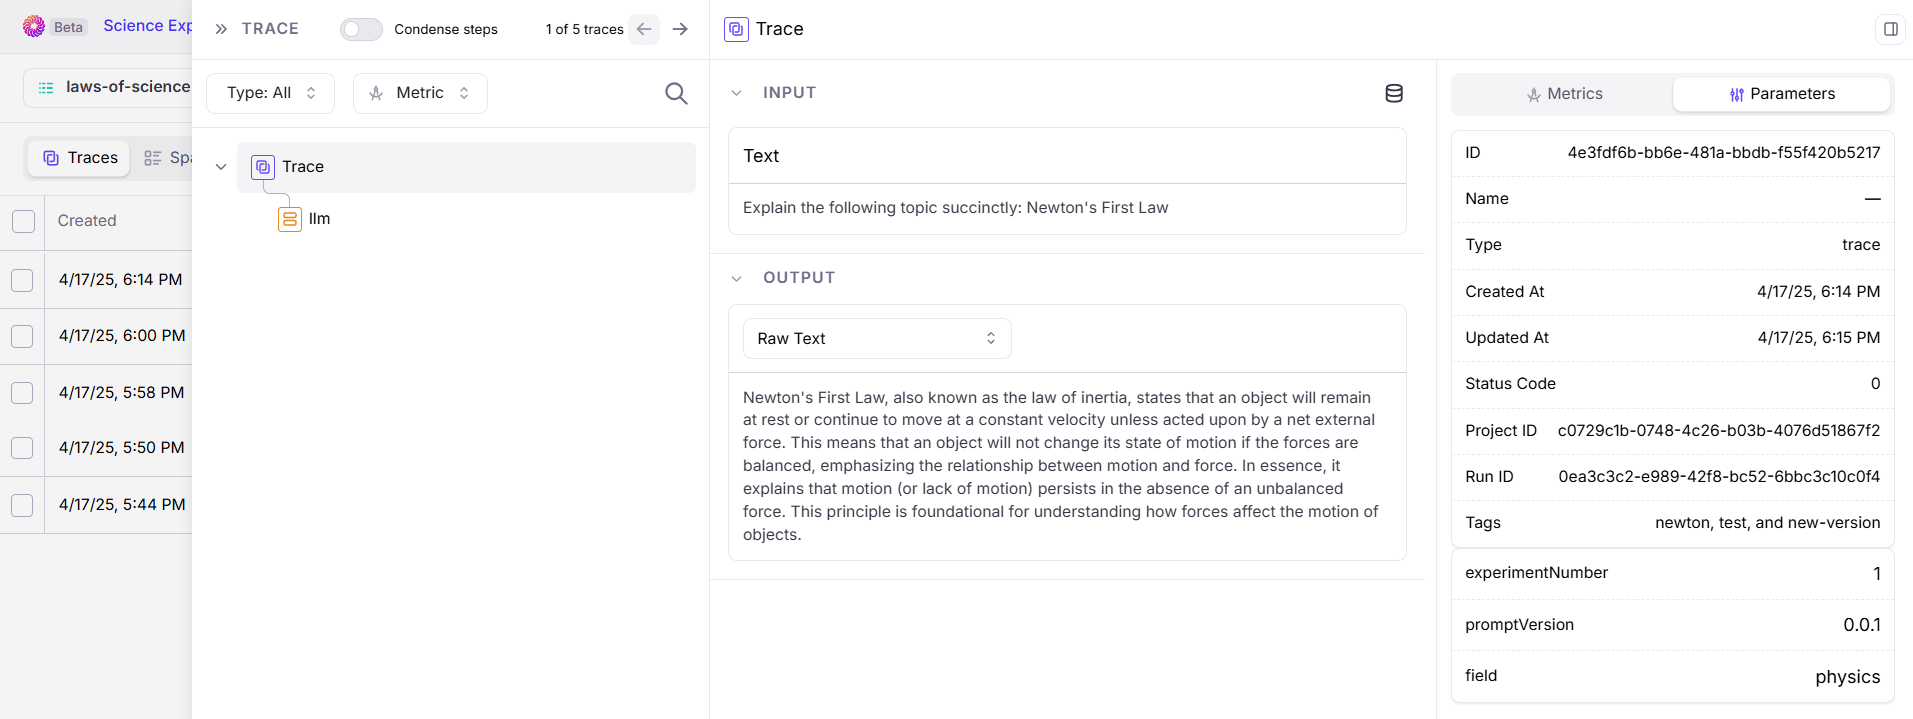
 Click on an entry in the list.\
You will see the data logged to the Trace. This includes:
* The raw text input (because we initialized the Trace with `input=prompt`)
* The raw text output from the LLM
(because we closed the Trace with `logger.conclude(answer)`)
* The tags and metadata we created
(found in the **Parameters** section in the top-right)
Click on an entry in the list.\
You will see the data logged to the Trace. This includes:
* The raw text input (because we initialized the Trace with `input=prompt`)
* The raw text output from the LLM
(because we closed the Trace with `logger.conclude(answer)`)
* The tags and metadata we created
(found in the **Parameters** section in the top-right)
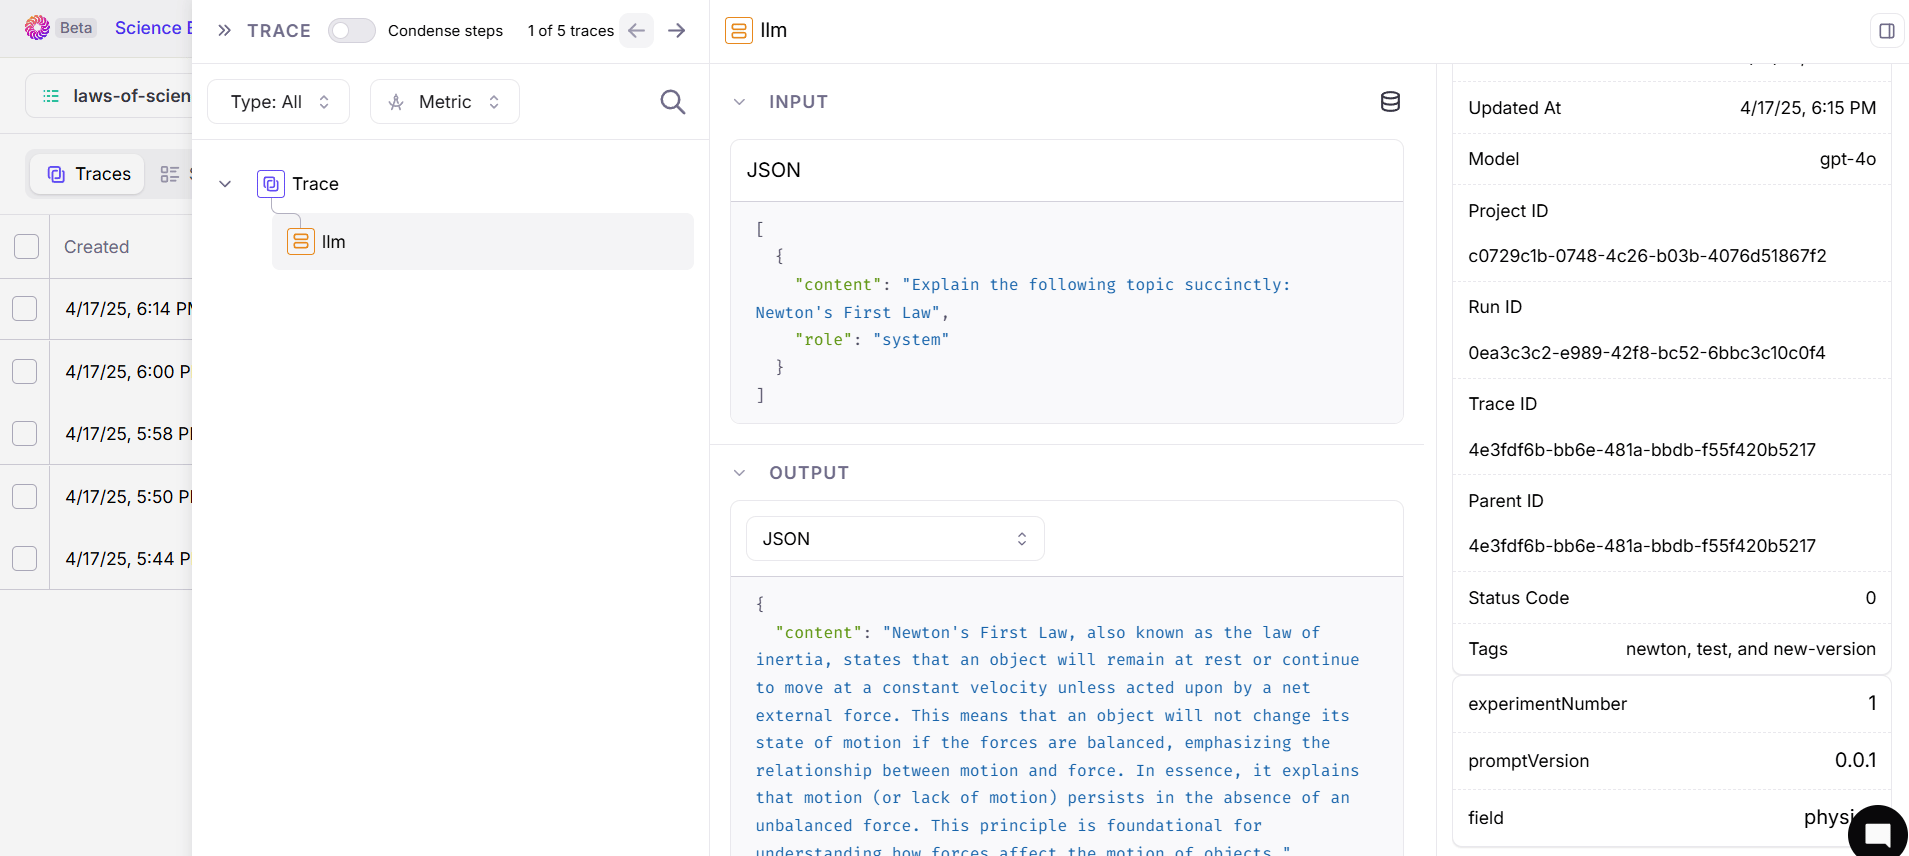
 With the Trace open, click the `llm` button below `Trace`
in the data map on the left.\
You will see the data logged to the Span. This includes:
* The complete JSON LLM input
(because we created the Span with `input=[{"role": "system", "content": prompt}]`)
* The complete JSON LLM output
(because we created the Span with `output=response.choices[0].message.content`)
* The tags and metadata we created
(found in the **Parameters** section in the top-right)
With the Trace open, click the `llm` button below `Trace`
in the data map on the left.\
You will see the data logged to the Span. This includes:
* The complete JSON LLM input
(because we created the Span with `input=[{"role": "system", "content": prompt}]`)
* The complete JSON LLM output
(because we created the Span with `output=response.choices[0].message.content`)
* The tags and metadata we created
(found in the **Parameters** section in the top-right)
 ## Session metadata
In addition to adding metadata to Traces and Spans, you can also add metadata to [Sessions](/concepts/logging/sessions/sessions-overview). Session metadata allows you to attach structured information like customer IDs, environment names, or application versions at the session level.
To add metadata to a session, pass the `metadata` parameter when starting a session:
```python Python theme={null}
# Start a session with metadata
session_id = logger.start_session(
name="My session",
external_id="chat-1",
metadata={"brand_id": "acme", "environment": "production"}
)
```
Session metadata keys and values follow the same rules as Trace and Span metadata:
* Metadata is a flat dictionary (no nested objects or arrays).
* Both keys and values must be strings.
* Each key and value is limited to 256 characters.
Session metadata is visible as columns in the Sessions view. Use the column selector to display specific metadata keys. Session metadata is not currently shown in the Trace detail view.
## Best practices
Use **Tags and Metadata** to:
* Keep your [experimentation](/sdk-api/experiments/experiments) process organized.
* Coordinate with your team and track development.
* Track individual steps in your AI project with [Traces](/sdk-api/logging/splunk-ao-logger#start-a-trace) containing multiple [Spans](/sdk-api/logging/splunk-ao-logger#add-spans) that each have their own distinct tags and metadata.
* Use the tag and metadata values in your code to automate alerts and improvements.
* Tag early. Start the trace yourself and pass tags before the first LLM call; otherwise auto-spans may end up in an untagged trace.
* Keep tags coarse-grained. A handful of well-chosen tags beat hundreds of one-offs.
* Standardize metadata keys. Stick to a naming convention (`experiment`, `user_id`, etc.) so dashboards stay tidy.
* Avoid sensitive data. Never put [PII](/concepts/evaluators/safety-and-compliance/pii) or keys in either tags or metadata; they become queryable in the UI.
## Session metadata
In addition to adding metadata to Traces and Spans, you can also add metadata to [Sessions](/concepts/logging/sessions/sessions-overview). Session metadata allows you to attach structured information like customer IDs, environment names, or application versions at the session level.
To add metadata to a session, pass the `metadata` parameter when starting a session:
```python Python theme={null}
# Start a session with metadata
session_id = logger.start_session(
name="My session",
external_id="chat-1",
metadata={"brand_id": "acme", "environment": "production"}
)
```
Session metadata keys and values follow the same rules as Trace and Span metadata:
* Metadata is a flat dictionary (no nested objects or arrays).
* Both keys and values must be strings.
* Each key and value is limited to 256 characters.
Session metadata is visible as columns in the Sessions view. Use the column selector to display specific metadata keys. Session metadata is not currently shown in the Trace detail view.
## Best practices
Use **Tags and Metadata** to:
* Keep your [experimentation](/sdk-api/experiments/experiments) process organized.
* Coordinate with your team and track development.
* Track individual steps in your AI project with [Traces](/sdk-api/logging/splunk-ao-logger#start-a-trace) containing multiple [Spans](/sdk-api/logging/splunk-ao-logger#add-spans) that each have their own distinct tags and metadata.
* Use the tag and metadata values in your code to automate alerts and improvements.
* Tag early. Start the trace yourself and pass tags before the first LLM call; otherwise auto-spans may end up in an untagged trace.
* Keep tags coarse-grained. A handful of well-chosen tags beat hundreds of one-offs.
* Standardize metadata keys. Stick to a naming convention (`experiment`, `user_id`, etc.) so dashboards stay tidy.
* Avoid sensitive data. Never put [PII](/concepts/evaluators/safety-and-compliance/pii) or keys in either tags or metadata; they become queryable in the UI.