> ## Documentation Index
> Fetch the complete documentation index at: https://agent-observability-docs.splunk.com/llms.txt
> Use this file to discover all available pages before exploring further.
# Claude
> Learn how to send traces from Claude to Splunk Agent Observability for evaluation
This integration is in Public Beta. Details may change until this integration is generally available.
Splunk Agent Observability integrates with [Claude Managed Agents](https://platform.claude.com/docs/en/managed-agents/overview), the [Messages API](https://platform.claude.com/docs/en/build-with-claude/working-with-messages), and [Claude SDK](https://platform.claude.com/docs/en/cli-sdks-libraries/overview#client-sdks) through OpenTelemetry — bringing model requests, agent turns, and tool activity into one observability experience. Teams can inspect how agents respond, identify slow operations, track token usage, and review prompts and responses when content capture is enabled.
Claude Platform exports spans for Claude Managed Agents sessions and Message API requests directly to the configured Splunk Agent Observability destination.
## Prerequisite
This setup requires Claude OpenTelemetry access and an administrator who can manage telemetry destinations. Learn more in the [Claude OpenTelemetry documentation](https://platform.claude.com/docs/en/manage-claude/opentelemetry/api).
## Configure the OpenTelemetry destination
Open [Claude Console > OpenTelemetry](https://platform.claude.com/settings/telemetry-destinations), select **Add destination**, and enter the following values. Use the endpoint and authentication details supplied for your Splunk Agent Observability deployment.
| Field | What to enter (Example) |
| - | - |
| Provider | `Splunk` |
| Name (Optional) | Claude Managed Agents — Splunk US1 |
| API URL | `https:///otel` — for example, `https://api.galileo.ai/otel` ([How to get your API URL](/api/getting-started#get-the-base-api-url)) |
| API key | `` ([How to get your API key](/references/faqs/find-keys#splunk-ao-api-key)) |
| Project name | `` — for example, `claude-demo` |
| Agent Stream name | `` — for example, `agent-traces` |
| Content mode | **Full content** — includes message and tool content |
| Workspaces | **Selected** → choose your workspace |
| Advanced → OTLP traces endpoint URL | Leave blank for this example |
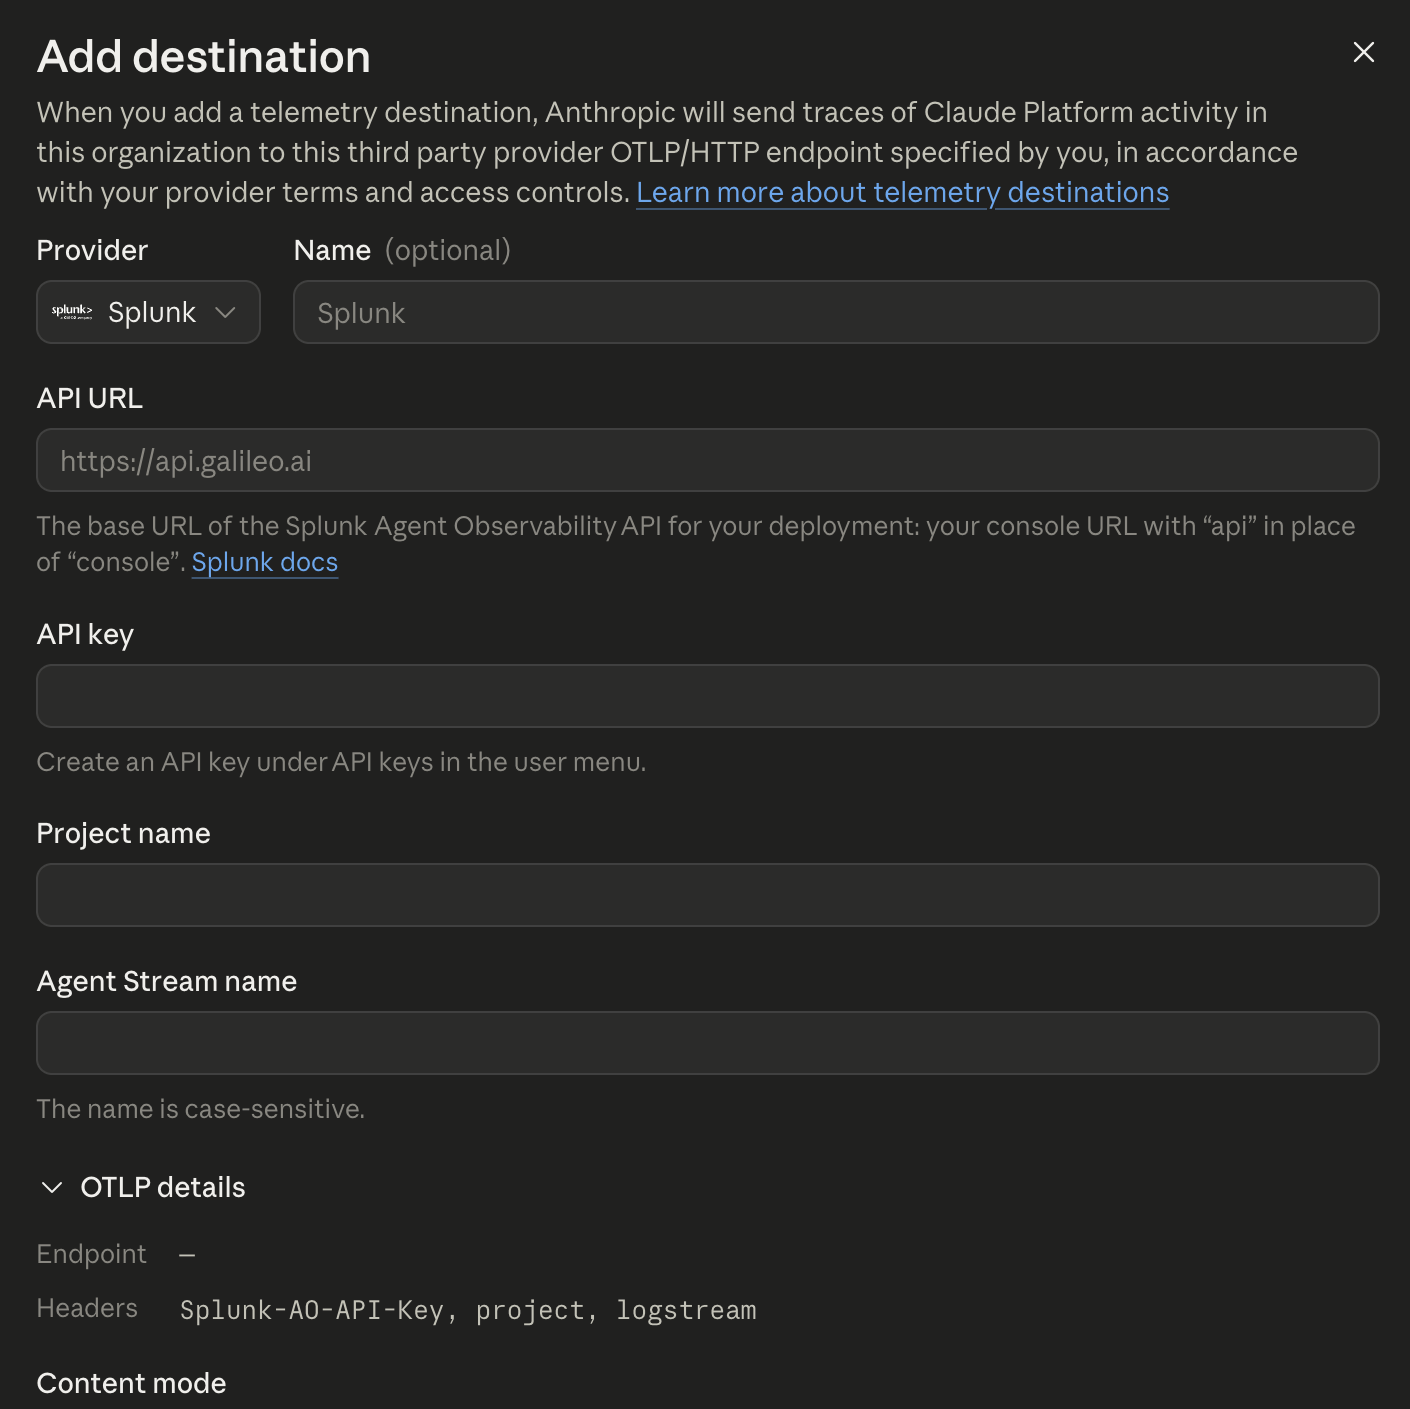 The **Name** field is an optional display label.
The **API URL** determines the backend. With the example base URL above, Claude sends traces to `https://api.galileo.ai/otel/v1/traces`. For a backend with a different trace path, enter its complete URL in **Advanced > OTLP traces endpoint URL**. Save the destination and ensure it is enabled. Learn more at the [Destination configuration reference](https://platform.claude.com/docs/en/manage-claude/opentelemetry/api#add-a-destination).
Enter the **API key**, **Project name**, and **Agent Stream name** for your deployment. The **OTLP details** are write-only and are hidden after saving. Set the **Content mode** as **Full content** to include message and tool content in the traces.
## Create an example agent and trigger traces
1. Open **Managed Agents > Agents** in your chosen workspace and create an agent named `calculator-demo`. See [Build in Console](https://platform.claude.com/docs/en/managed-agents/onboarding).
2. Choose an available Claude model and enter this system prompt: “You are an arithmetic assistant. Use the bash tool to calculate arithmetic requests. Report the result and the tool you used.” See [Agent configuration fields](https://platform.claude.com/docs/en/managed-agents/agent-setup).
3. Enable the built-in tools, including `bash`, and select a cloud environment. See [Tools](https://platform.claude.com/docs/en/managed-agents/tools) and [Cloud environment setup](https://platform.claude.com/docs/en/managed-agents/environments).
4. Create a deployment with a **Manual** trigger and this initial message: “Use the bash tool to calculate 17 x 23, then reply with the result and the tool you used.”
5. Save the deployment and select **Run now**. For the corresponding API operation, see [Trigger a manual run](https://platform.claude.com/docs/en/managed-agents/scheduled-deployments#trigger-a-manual-run).
6. Open the resulting session. Confirm that the agent called `bash` and returned **391**. See [Inspect sessions and track usage](https://platform.claude.com/docs/en/managed-agents/session-observability).
The example below shows the tool invocation and resulting answer:
The **Name** field is an optional display label.
The **API URL** determines the backend. With the example base URL above, Claude sends traces to `https://api.galileo.ai/otel/v1/traces`. For a backend with a different trace path, enter its complete URL in **Advanced > OTLP traces endpoint URL**. Save the destination and ensure it is enabled. Learn more at the [Destination configuration reference](https://platform.claude.com/docs/en/manage-claude/opentelemetry/api#add-a-destination).
Enter the **API key**, **Project name**, and **Agent Stream name** for your deployment. The **OTLP details** are write-only and are hidden after saving. Set the **Content mode** as **Full content** to include message and tool content in the traces.
## Create an example agent and trigger traces
1. Open **Managed Agents > Agents** in your chosen workspace and create an agent named `calculator-demo`. See [Build in Console](https://platform.claude.com/docs/en/managed-agents/onboarding).
2. Choose an available Claude model and enter this system prompt: “You are an arithmetic assistant. Use the bash tool to calculate arithmetic requests. Report the result and the tool you used.” See [Agent configuration fields](https://platform.claude.com/docs/en/managed-agents/agent-setup).
3. Enable the built-in tools, including `bash`, and select a cloud environment. See [Tools](https://platform.claude.com/docs/en/managed-agents/tools) and [Cloud environment setup](https://platform.claude.com/docs/en/managed-agents/environments).
4. Create a deployment with a **Manual** trigger and this initial message: “Use the bash tool to calculate 17 x 23, then reply with the result and the tool you used.”
5. Save the deployment and select **Run now**. For the corresponding API operation, see [Trigger a manual run](https://platform.claude.com/docs/en/managed-agents/scheduled-deployments#trigger-a-manual-run).
6. Open the resulting session. Confirm that the agent called `bash` and returned **391**. See [Inspect sessions and track usage](https://platform.claude.com/docs/en/managed-agents/session-observability).
The example below shows the tool invocation and resulting answer:
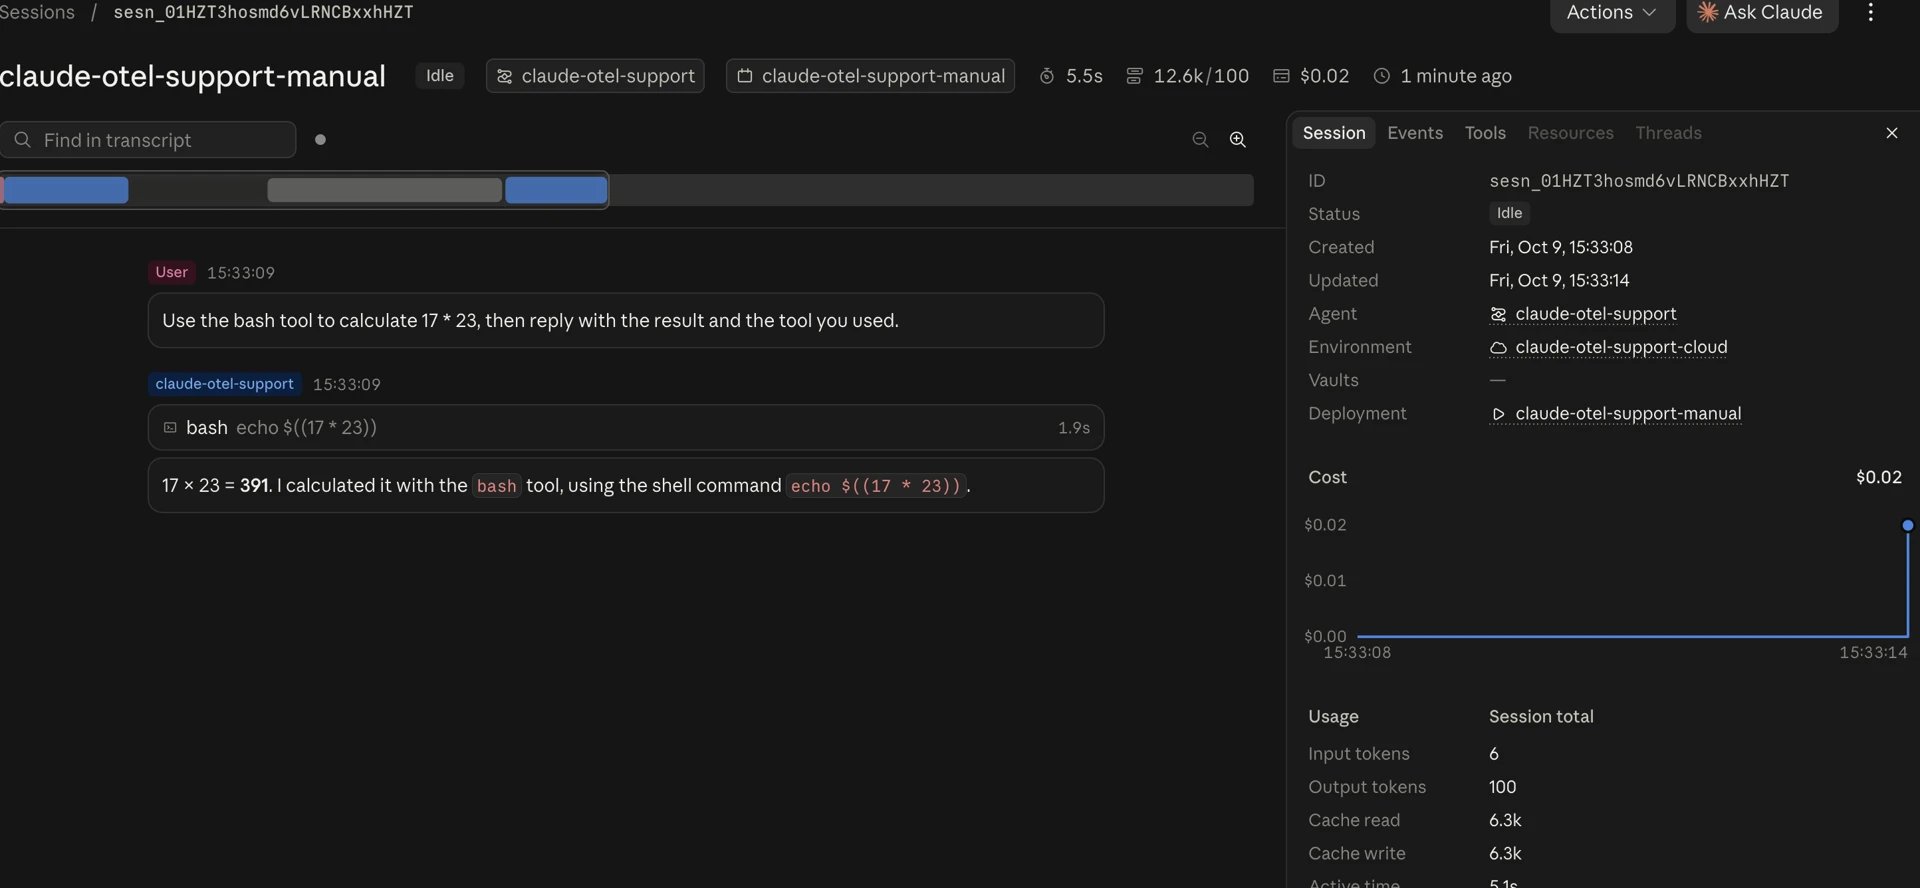 You can also test directly from the agent page using the Claude Console inline session runner. See [Testing an agent](https://platform.claude.com/docs/en/managed-agents/onboarding#testing-an-agent).
The example below shows the results of a successful test in the Claude Console.
You can also test directly from the agent page using the Claude Console inline session runner. See [Testing an agent](https://platform.claude.com/docs/en/managed-agents/onboarding#testing-an-agent).
The example below shows the results of a successful test in the Claude Console.
 ## Explore the agent activity in Splunk Agent Observability
After the run, check in the Claude Console that the destination's **Delivery** column shows **Healthy**. This can take about a minute.
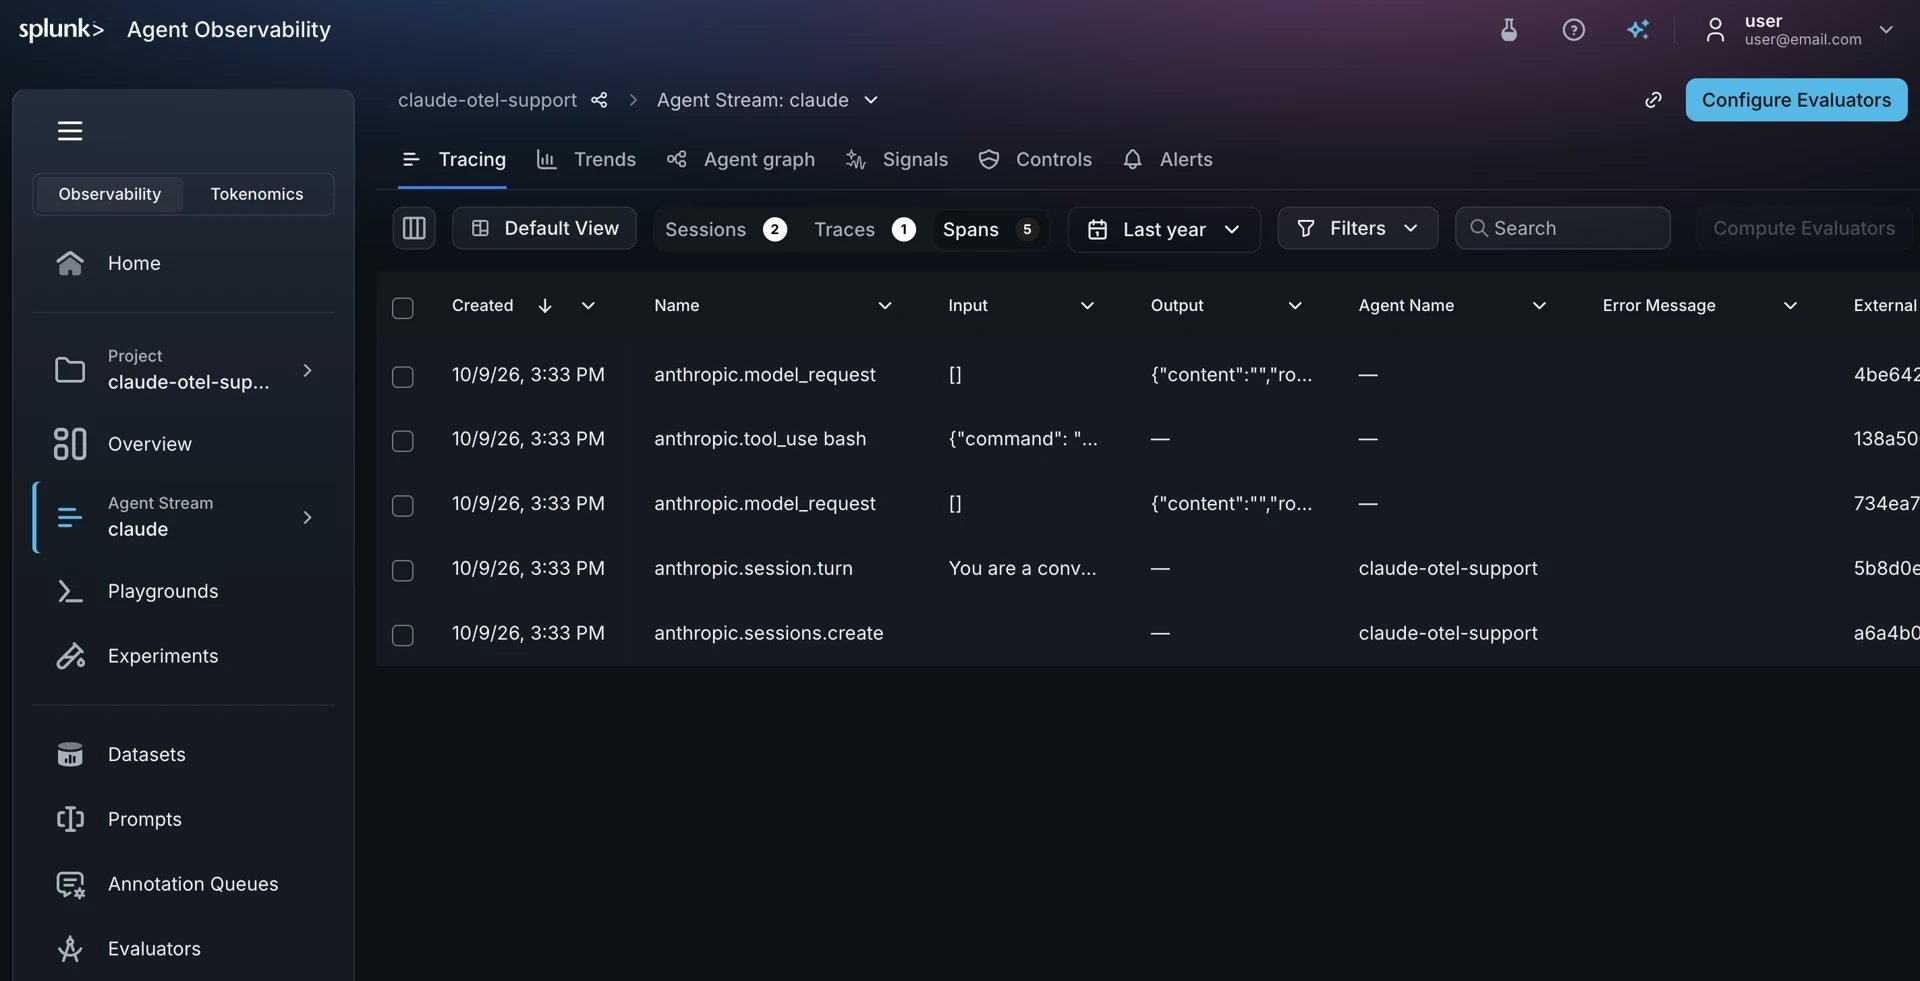
In Splunk Agent Observability, open the configured project and Agent Stream, then find the logged sessions, traces, and spans in the **Tracing** tab.
The calculator demo illustrates a typical sequence:
```text theme={null}
Sessions API request
└─ Agent turn
├─ Model request: chooses the tool
├─ Tool use: bash calculates 17 x 23
└─ Model request: returns the answer
```
## Explore the agent activity in Splunk Agent Observability
After the run, check in the Claude Console that the destination's **Delivery** column shows **Healthy**. This can take about a minute.
In Splunk Agent Observability, open the configured project and Agent Stream, then find the logged sessions, traces, and spans in the **Tracing** tab.
The calculator demo illustrates a typical sequence:
```text theme={null}
Sessions API request
└─ Agent turn
├─ Model request: chooses the tool
├─ Tool use: bash calculates 17 x 23
└─ Model request: returns the answer
```
 Claude also exports outcome evaluation spans when evaluations run. With **Full content**, the exported spans can include model inputs and outputs, tool arguments, and tool results. Group spans by `anthropic.session.id` when a session contains activity across multiple traces. Learn more in the [Managed Agents trace reference](https://platform.claude.com/docs/en/manage-claude/opentelemetry#a-managed-agents-session).
Platform tracing captures Claude managed operations. Additional instrumentation in your Python or other application code can add spans for processing inside a tool. Learn more about [installing the Claude SDK](https://platform.claude.com/docs/en/manage-claude/opentelemetry/sdk#install-the-sdk).
This documentation is built and hosted on [Mintlify](https://mintlify.com), a developer documentation platform.
Claude also exports outcome evaluation spans when evaluations run. With **Full content**, the exported spans can include model inputs and outputs, tool arguments, and tool results. Group spans by `anthropic.session.id` when a session contains activity across multiple traces. Learn more in the [Managed Agents trace reference](https://platform.claude.com/docs/en/manage-claude/opentelemetry#a-managed-agents-session).
Platform tracing captures Claude managed operations. Additional instrumentation in your Python or other application code can add spans for processing inside a tool. Learn more about [installing the Claude SDK](https://platform.claude.com/docs/en/manage-claude/opentelemetry/sdk#install-the-sdk).
This documentation is built and hosted on [Mintlify](https://mintlify.com), a developer documentation platform.