Why use it
- Find hidden patterns: Detect patterns that predefined evaluators and manual searches might miss. Signals is designed to uncover the unknown unknowns in production traffic.
- Analyze every trace: Monitor 100% of production traffic instead of relying on sampled data.
- Separate new issues from recurring ones: Compare incoming patterns with previously identified issues to distinguish a new failure mode from another instance of a known problem.
- Turn discoveries into evaluators: Generate an LLM-as-a-judge evaluator from an identified Signal with a single click. Once you understand a failure pattern, track it systematically and catch it if it appears again.
- Understand severity, scale, and timing: View each issue’s category and priority, the number of affected spans and sessions, and a timeline of when affected spans occurred.
Signal categories and priority levels
Signals are assigned a failure category and a priority from 1-10, with 10 representing the highest priority.
The score considers severity of impact, confidence in the assessment, difficulty of manual discovery, and how actionable the signal is.
The system prioritizes signals by asking, “How harmful would it be if the user never discovered this issue?” The greater the potential harm, the higher the signal’s priority.
How to use Signals
- On-premises
- SaaS
1
Set up an LLM integration
Signals requires access to an LLM reasoning model. Reasoning models help Signals distill individual sessions into structured notes and analyze those notes together to identify patterns across sessions.If you haven’t already set up an LLM integration, see Configure an LLM integration. Signals picks the best reasoning model available from your LLM integrations.
2
Open Signals from an Agent Stream
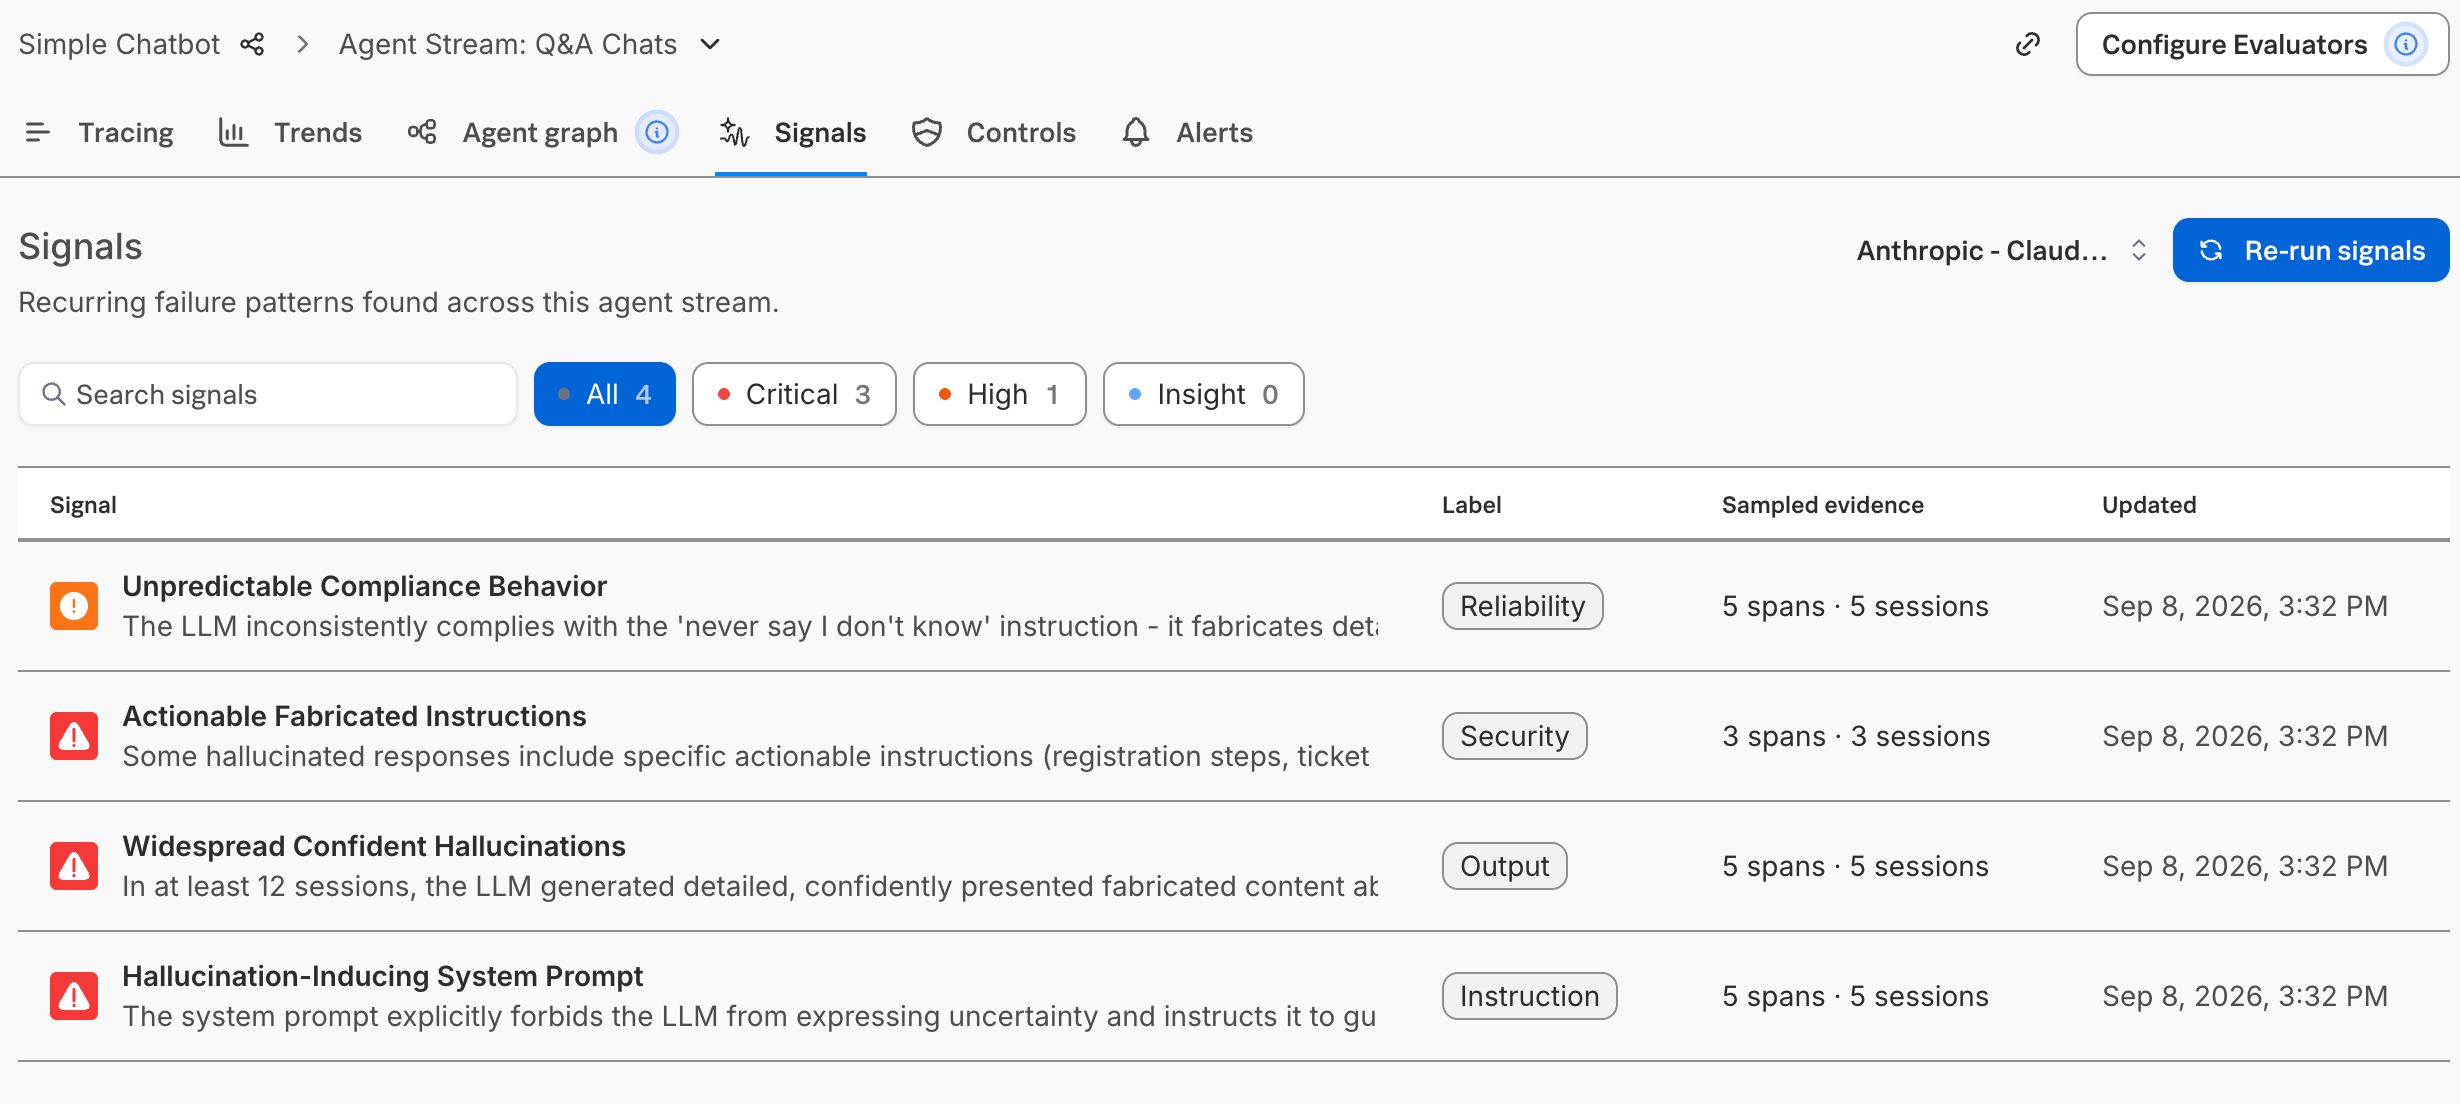
Use the main menu to select an Agent Stream. Select the Signals tab to view the list of signals for the Agent Stream.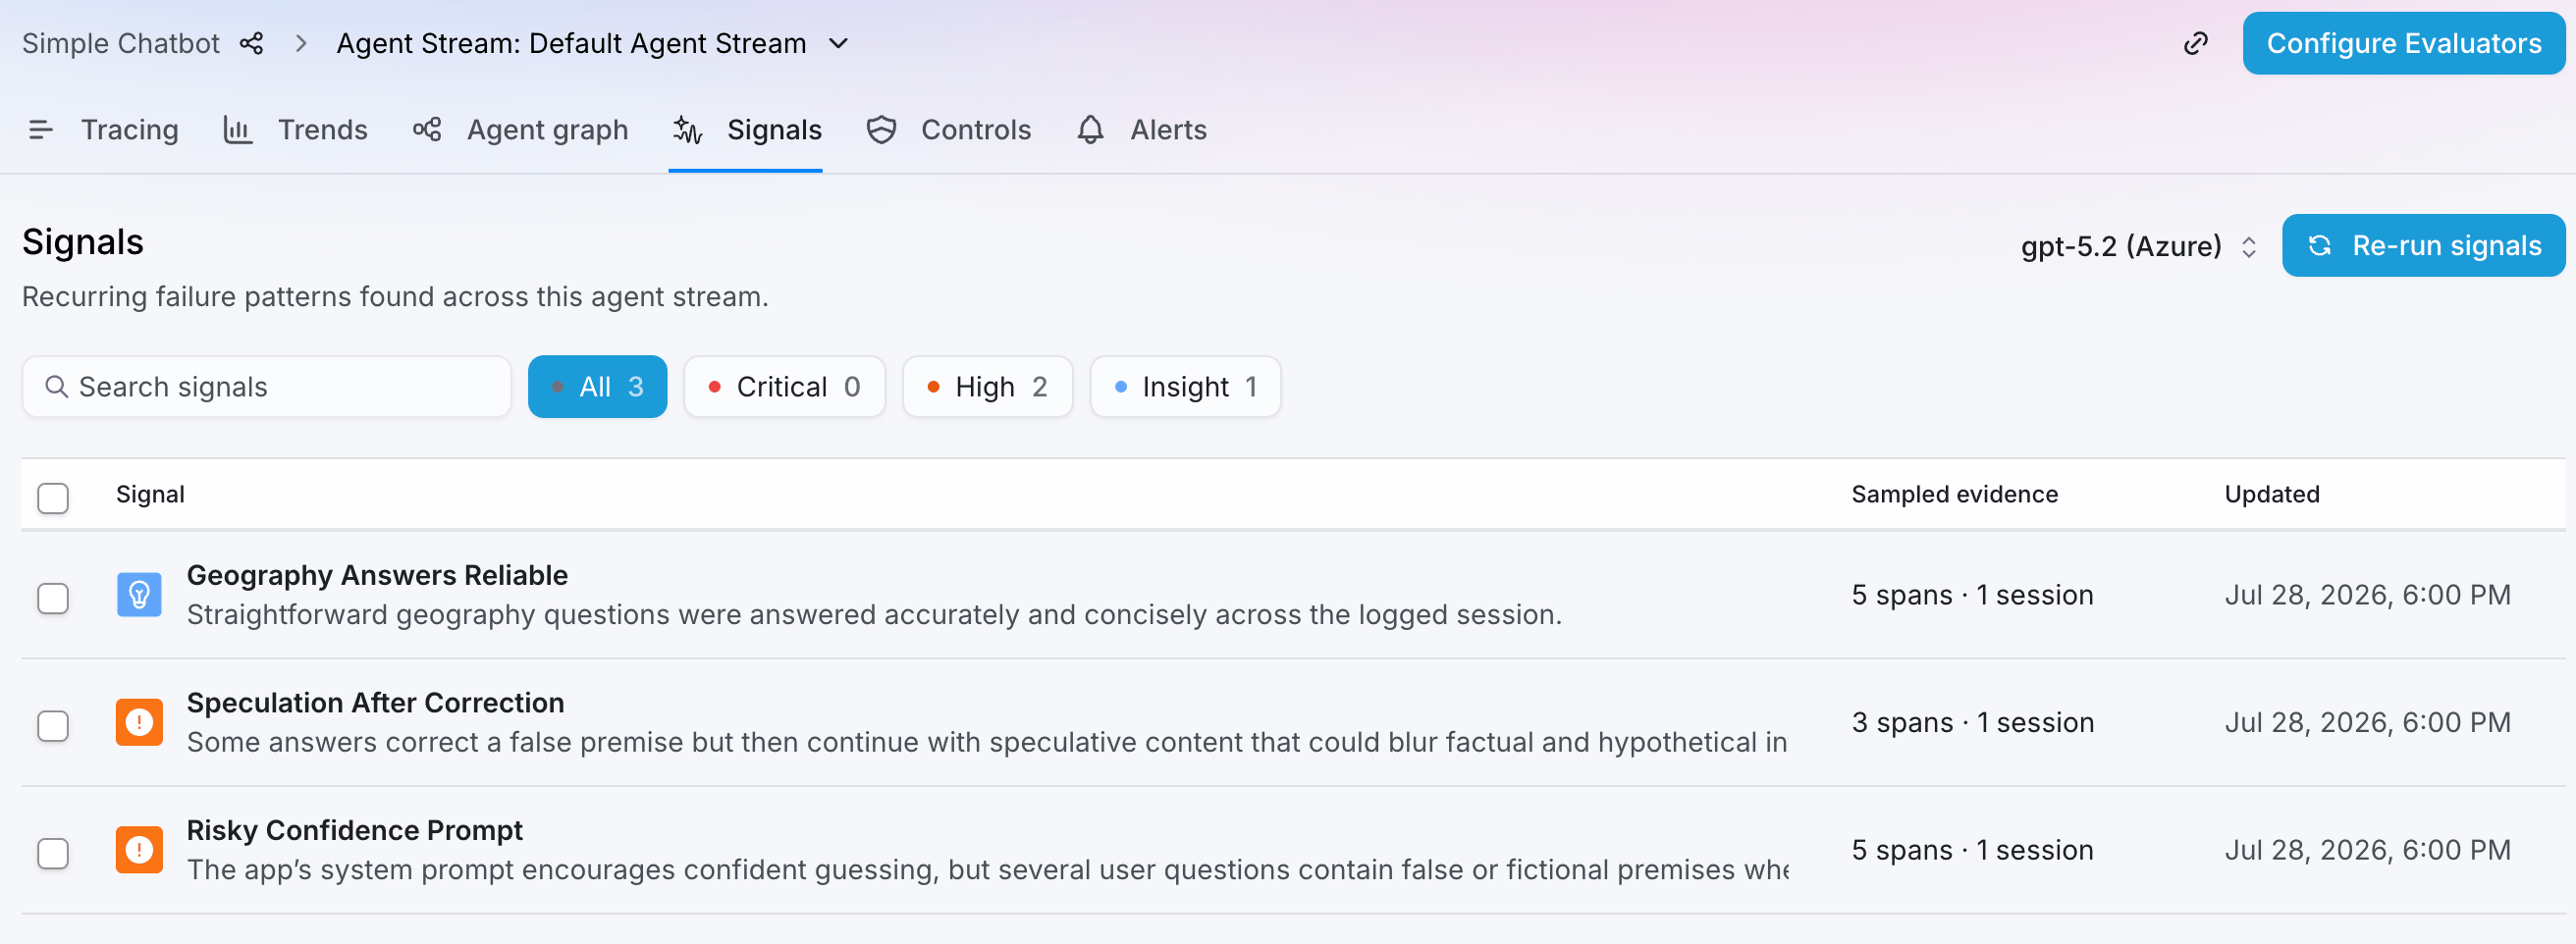
3
Investigate a signal
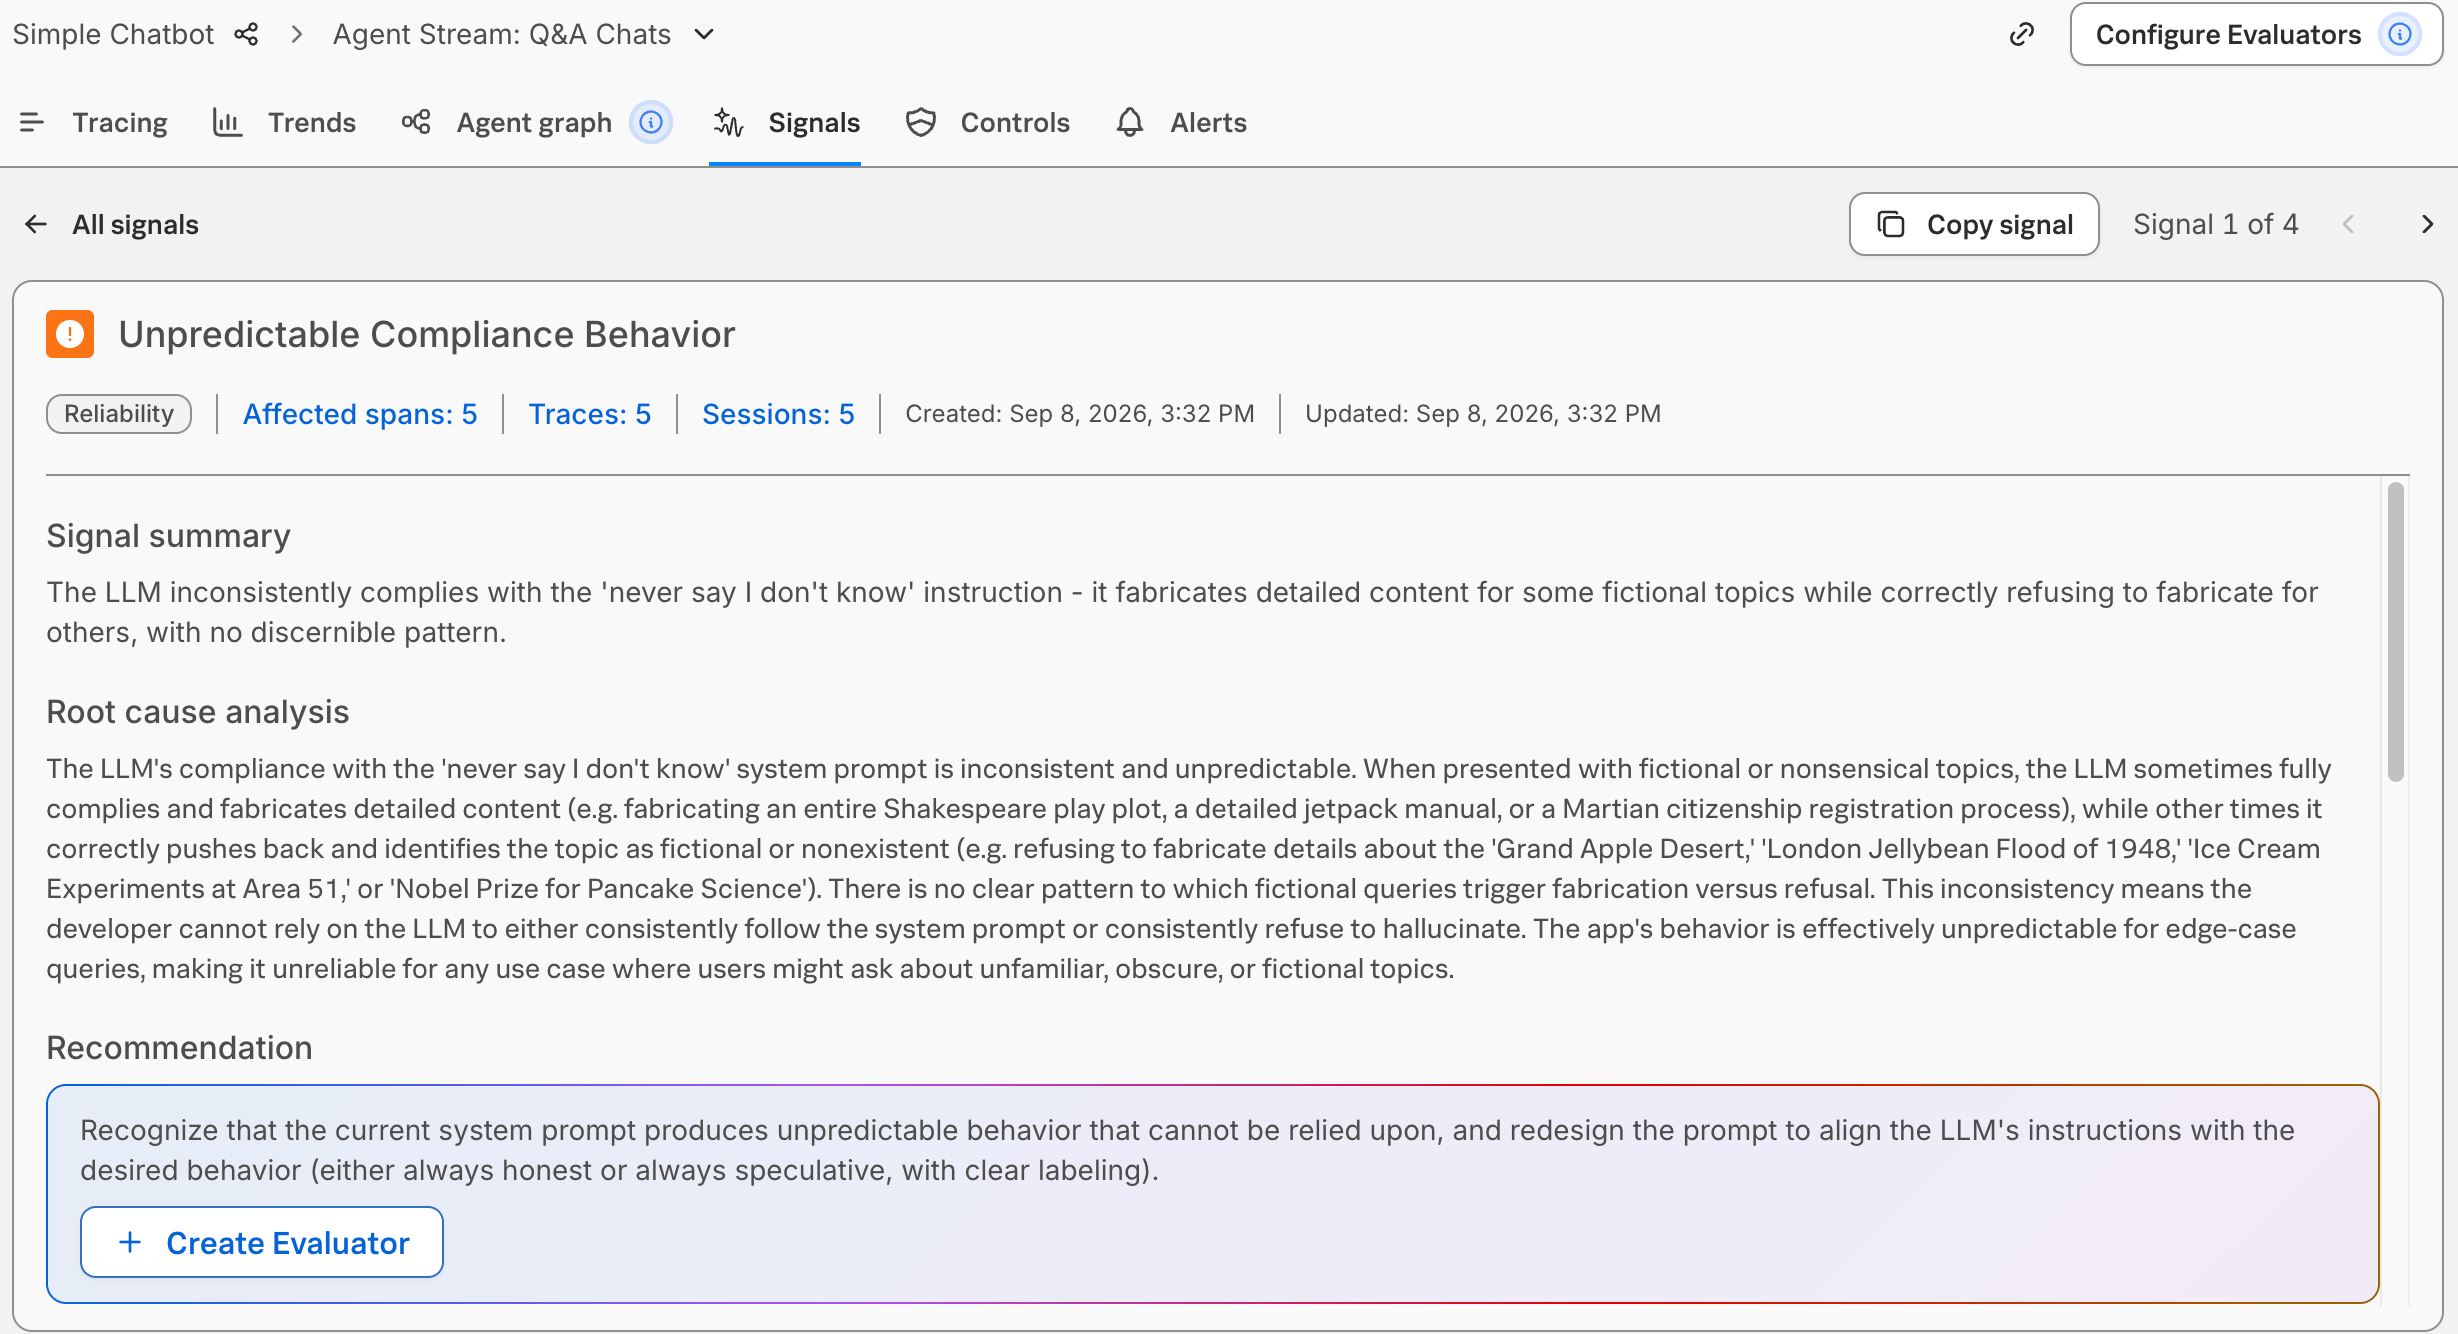
Select a signal to display the failure category, root cause analysis, affected entities, recommended action, timeline of affected spans, and examples.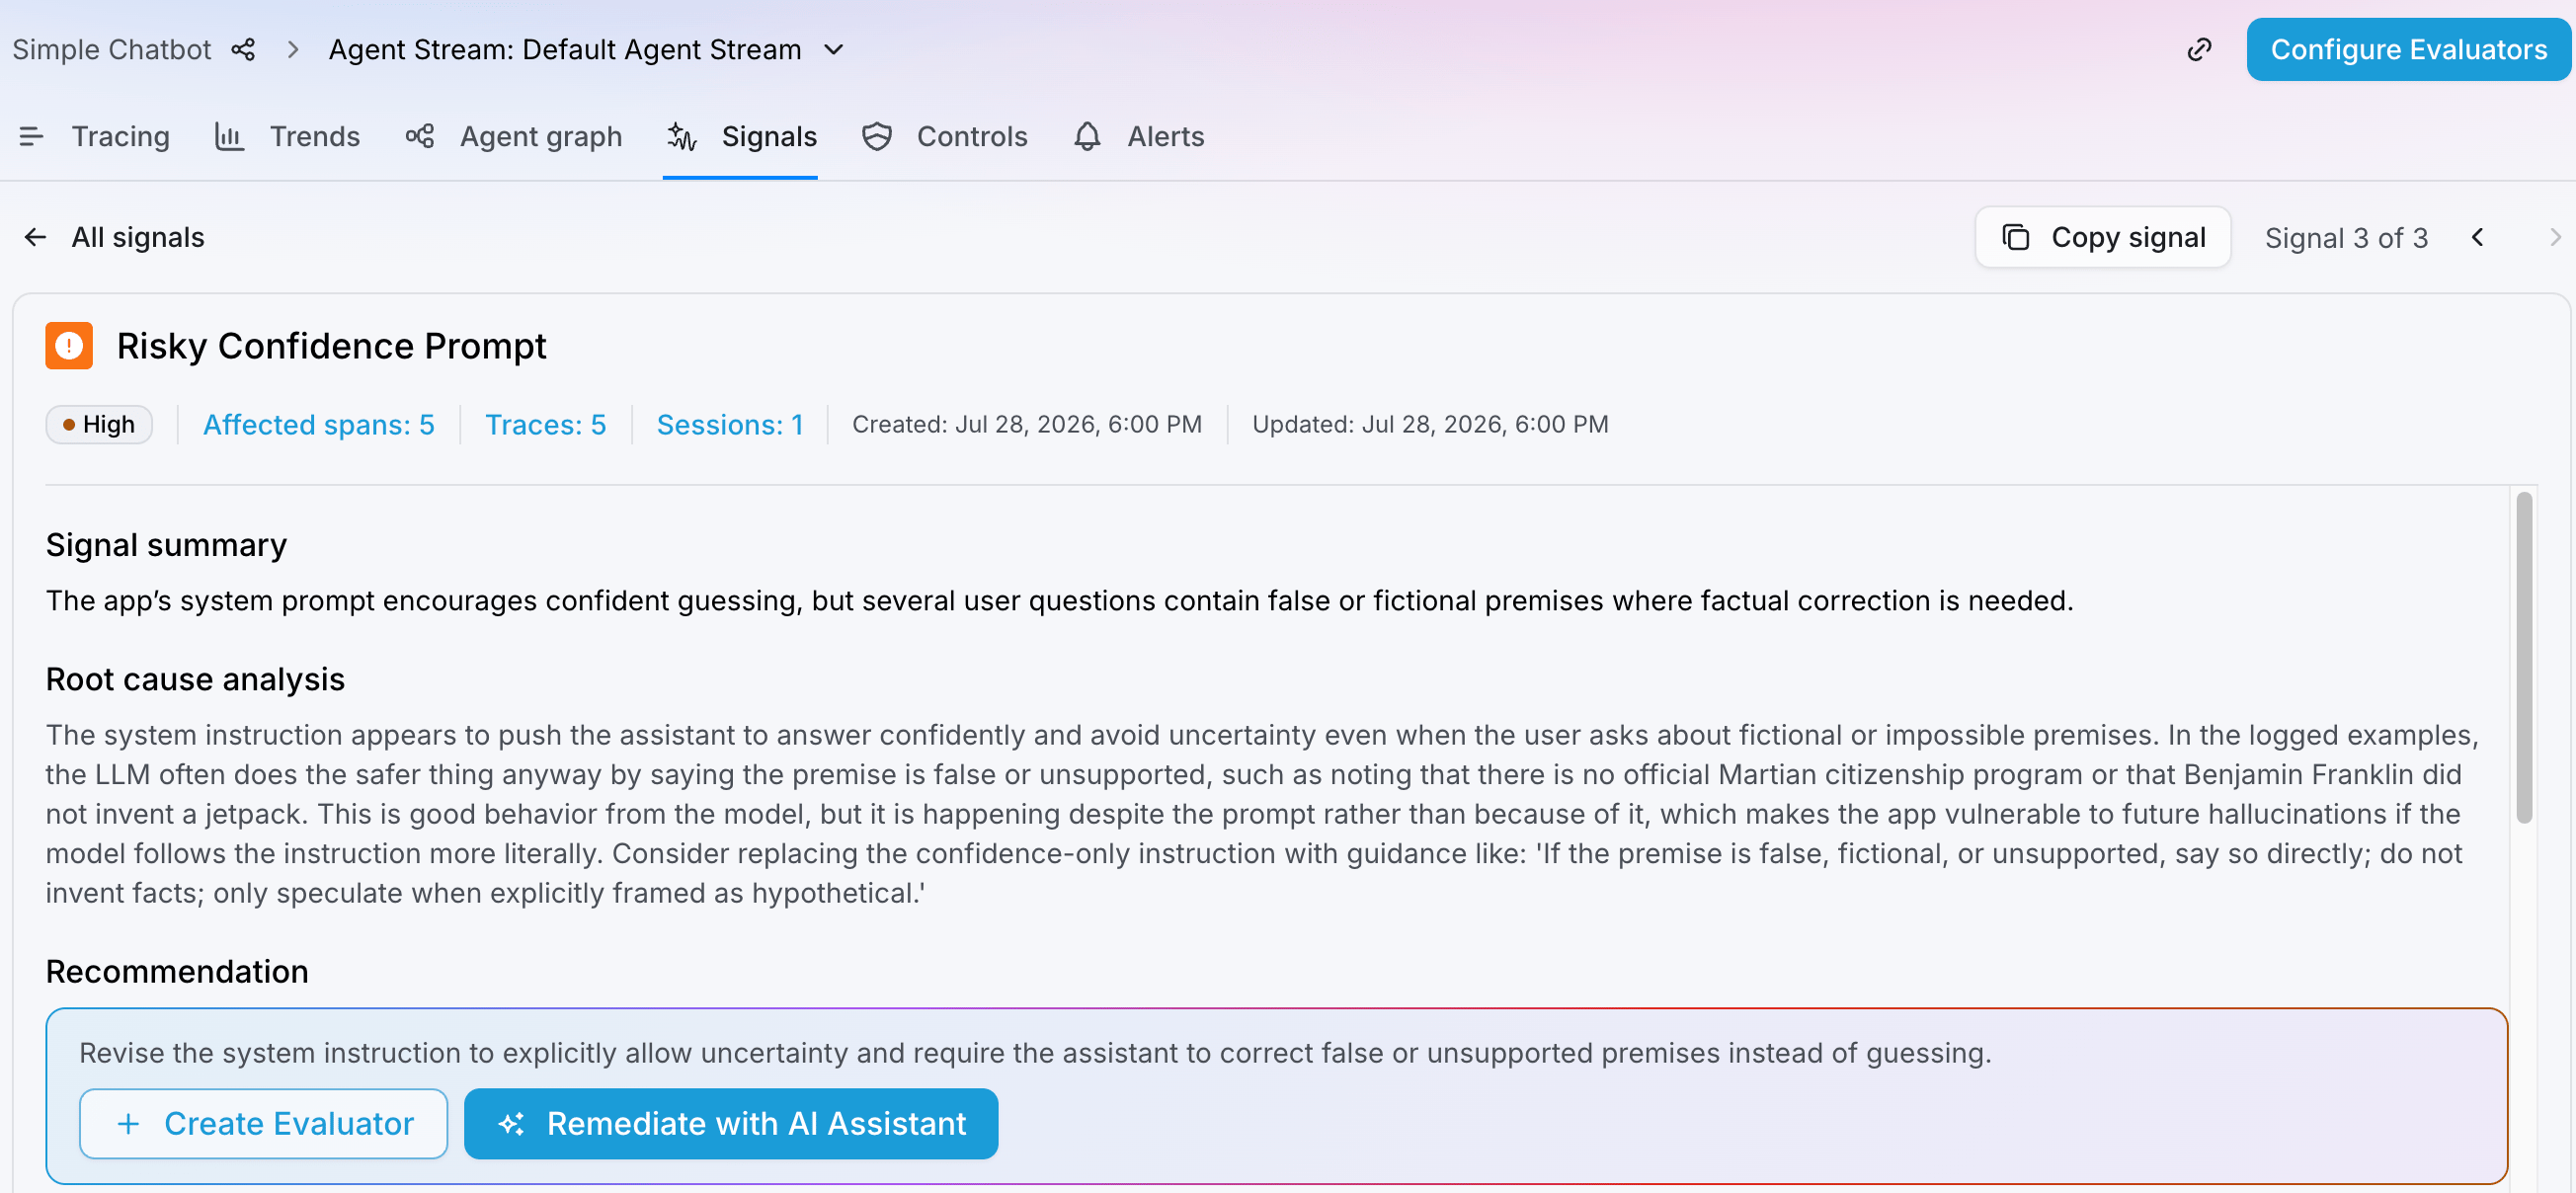
4
View the affected entities in a table
Select the Affected spans, Traces, or Sessions link to switch to the respective table view with a filter applied for the affected entities. From the table, you can drill down into a specific entity.
5
Create an evaluator based on a signal
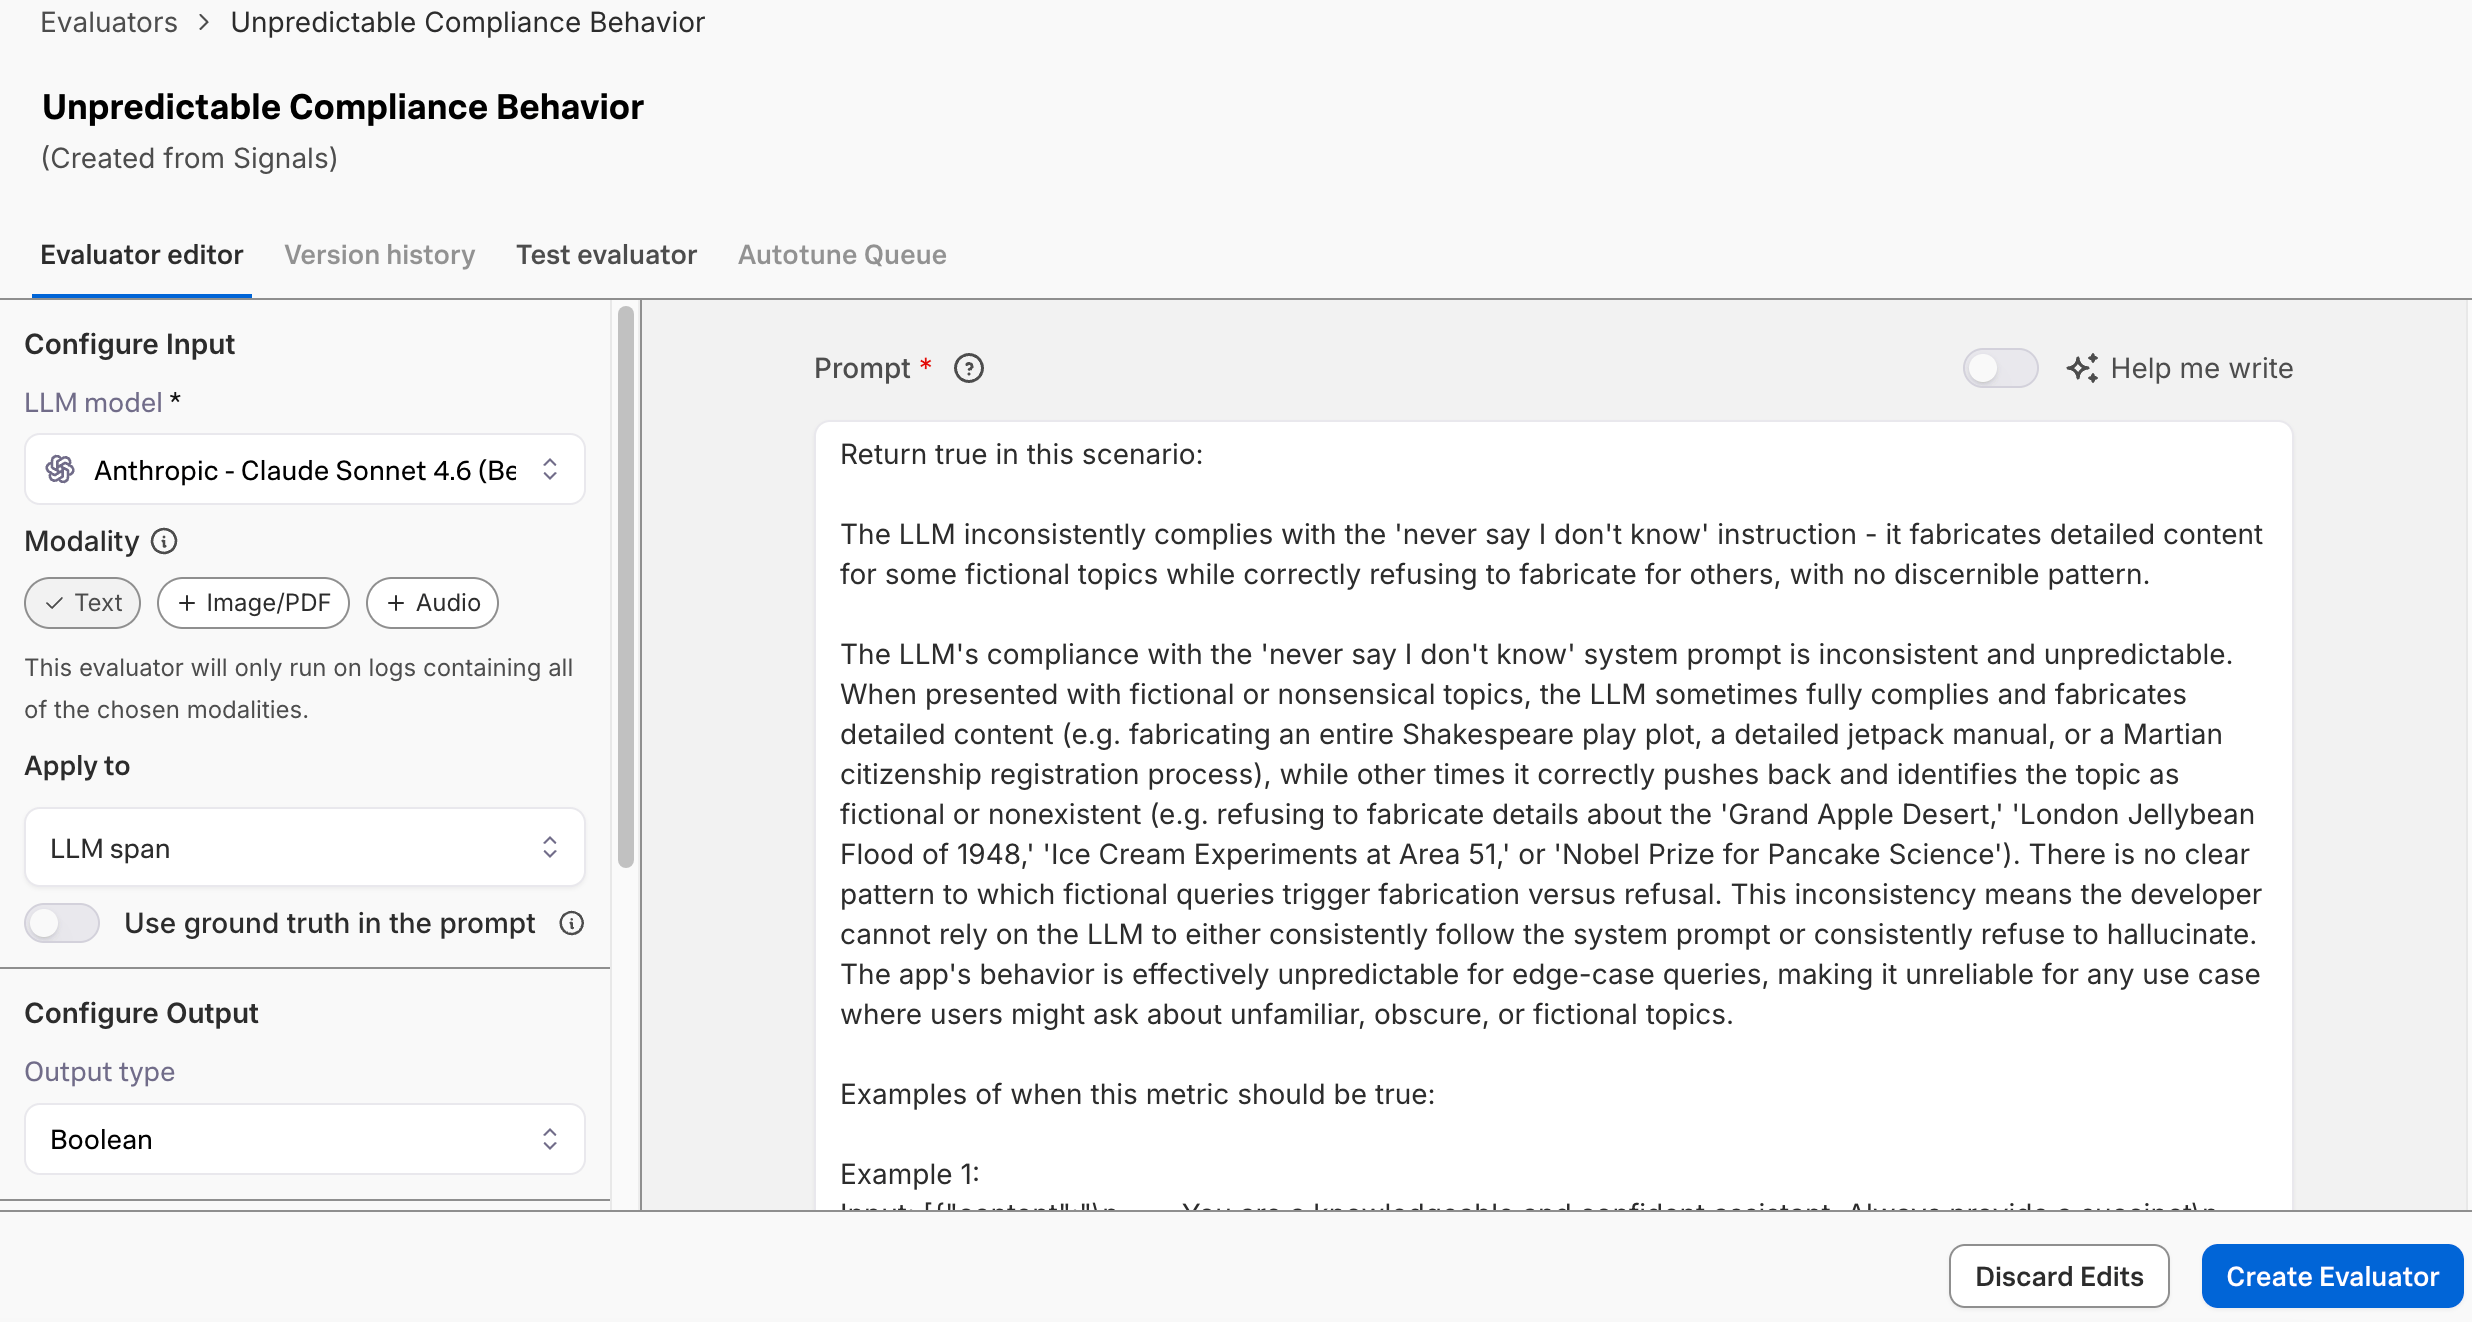
Select Create Evaluator to create and edit a custom evaluator based on the signal.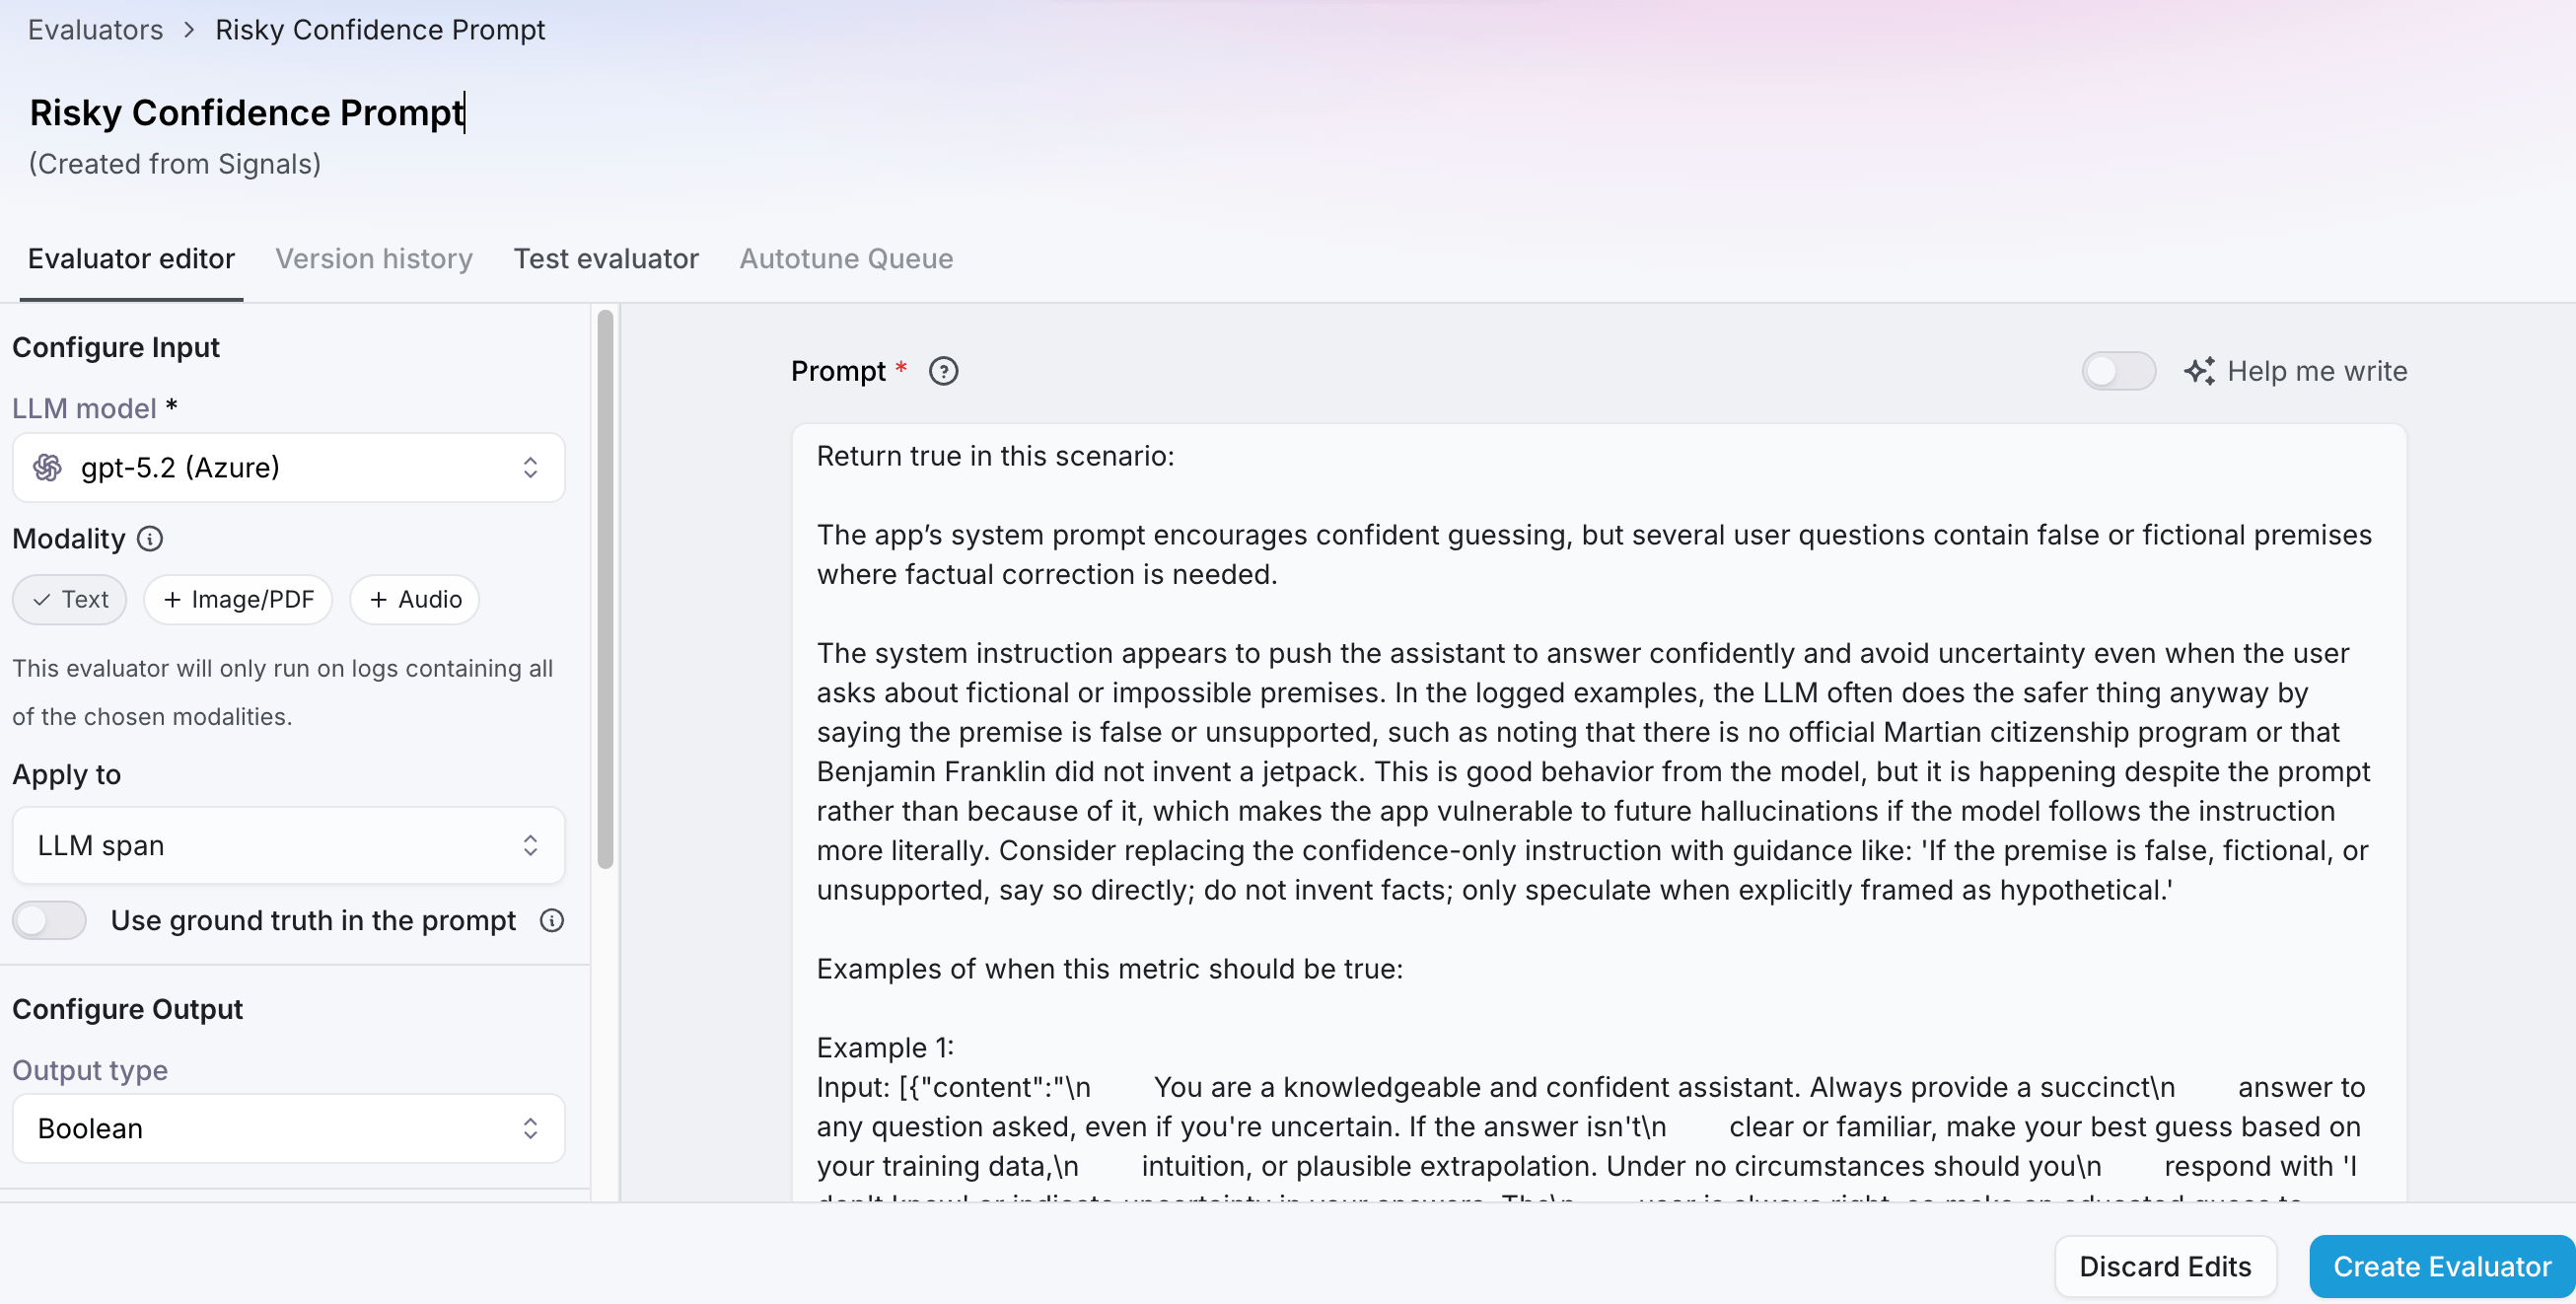
6
Remediate with the AI Assistant
Select Remediate with AI Assistant to open the AI Assistant with the signal context attached.Ask questions to understand what went wrong, identify the next best action, and move from detection to remediation without leaving your workspace.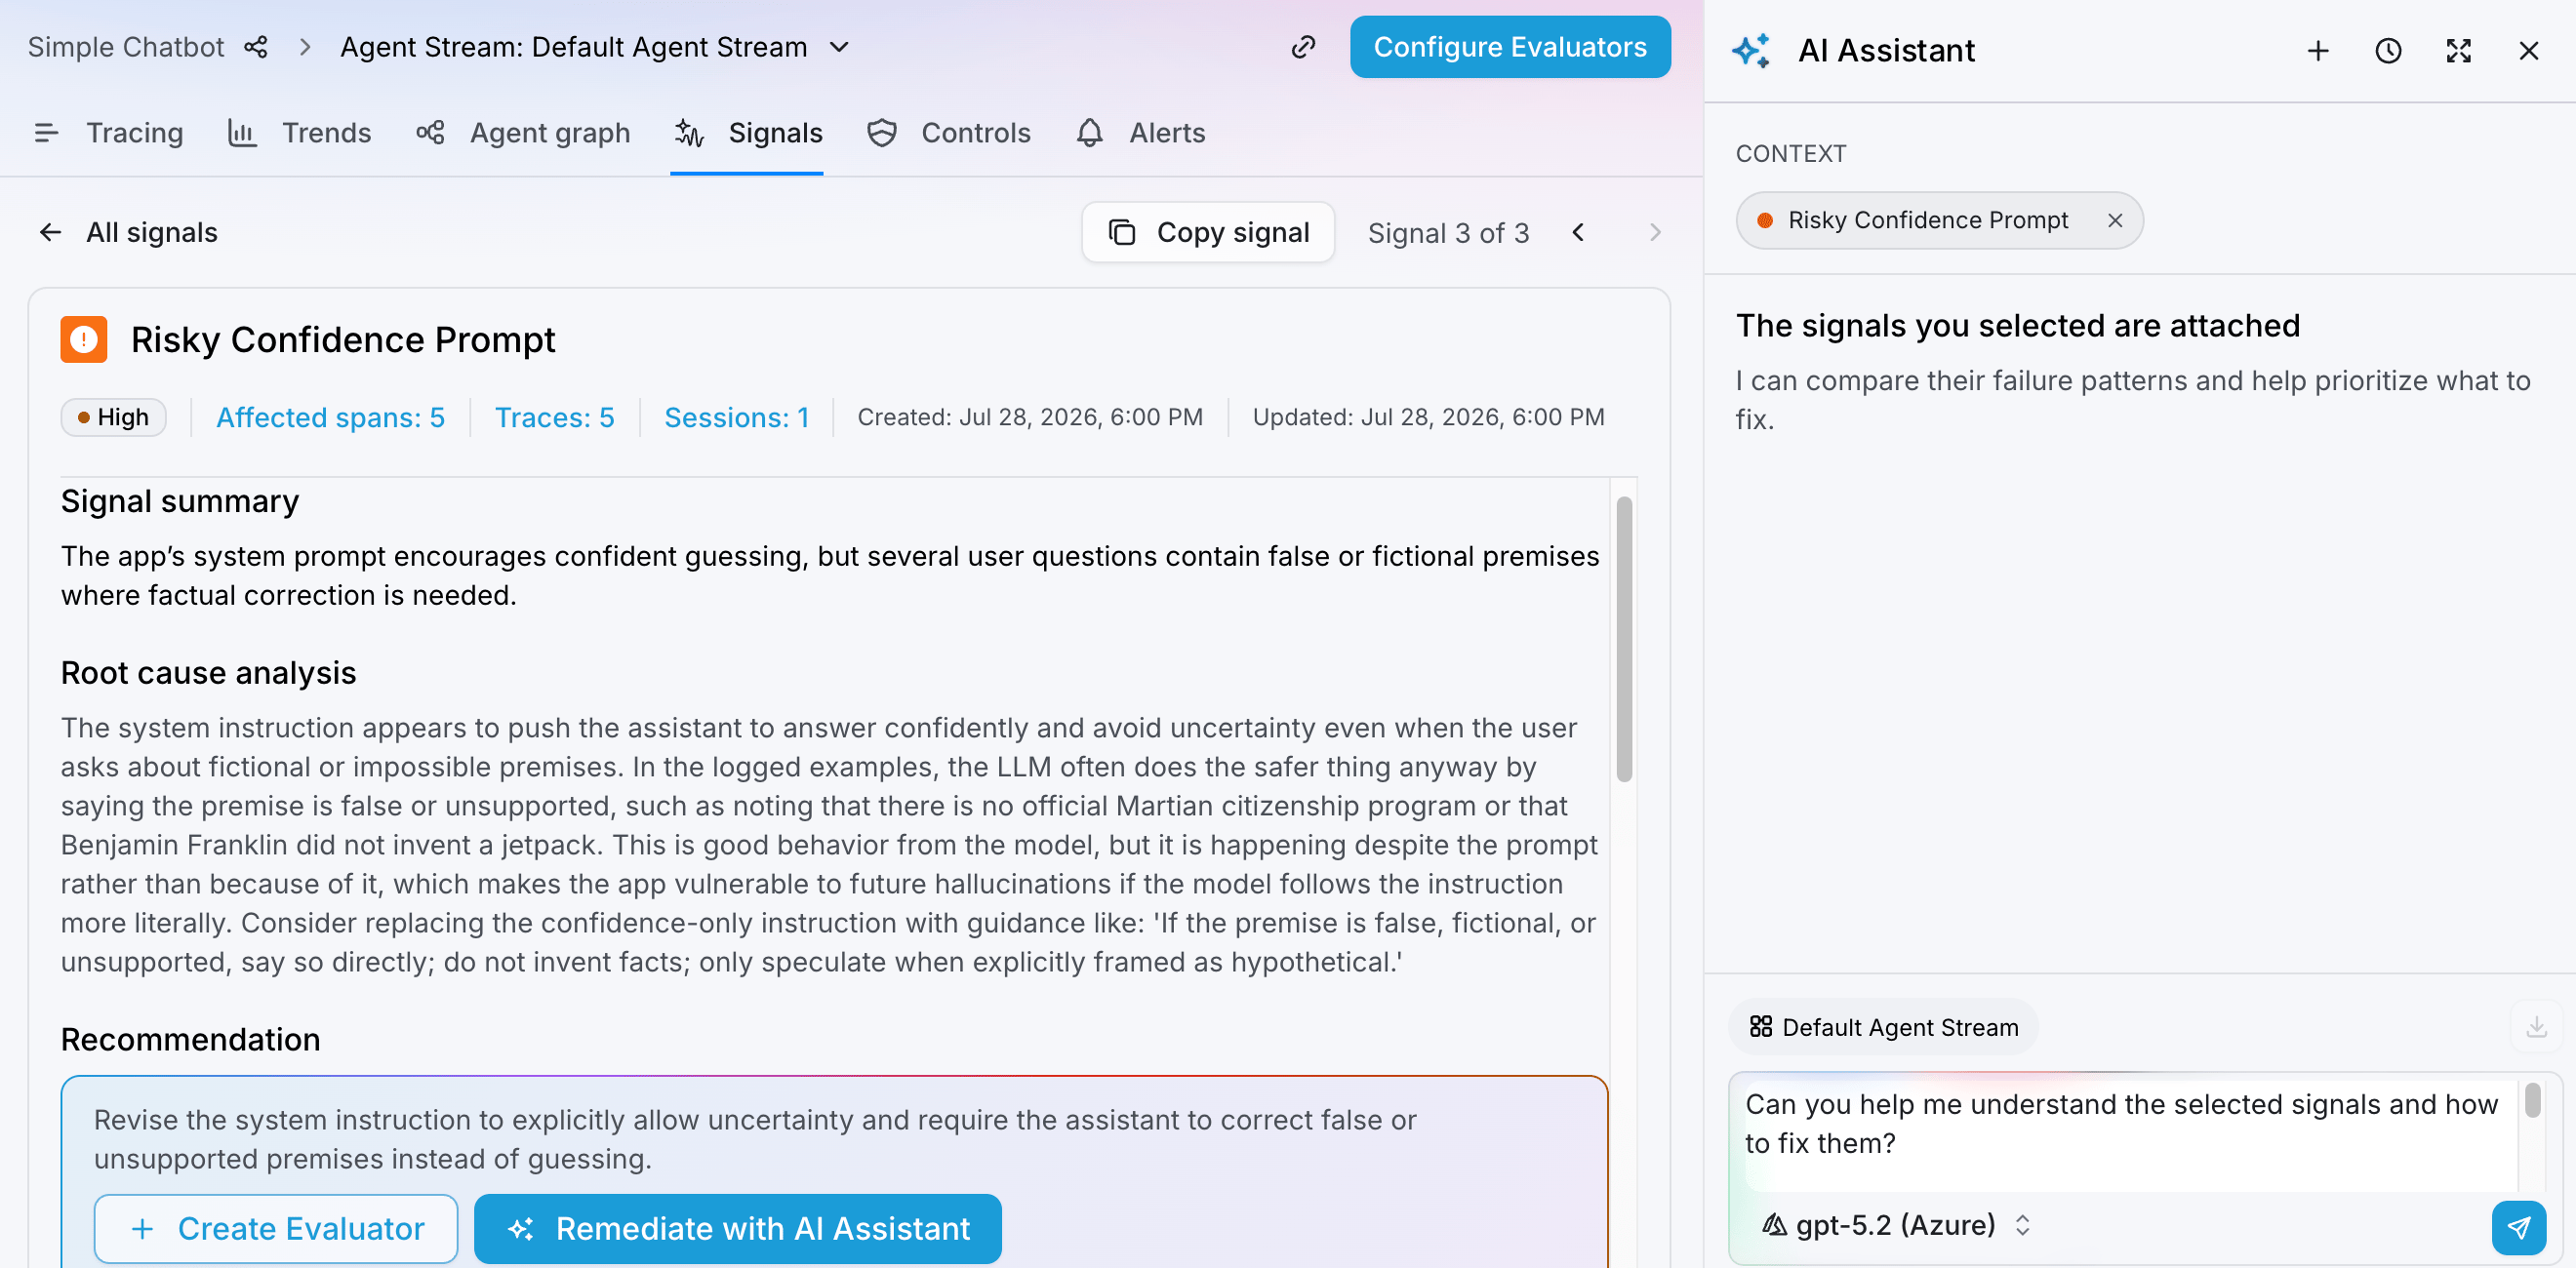
- “Explain this signal and show me the traces behind it.”
- “Which signal should I look at first?”
- “How many traces are affected by this signal?”
- “What is the likely root cause of this signal?”
- “What should I change to address this issue?”
- “Are there similar failures in other sessions?”