

This integration is in Public Beta. Details may change until this integration is generally available.
Prerequisite
This setup requires Claude OpenTelemetry access and an administrator who can manage telemetry destinations. Learn more in the Claude OpenTelemetry documentation.Configure the OpenTelemetry destination
Open Claude Console > OpenTelemetry, select Add destination, and enter the following values. Use the endpoint and authentication details supplied for your Splunk Agent Observability deployment.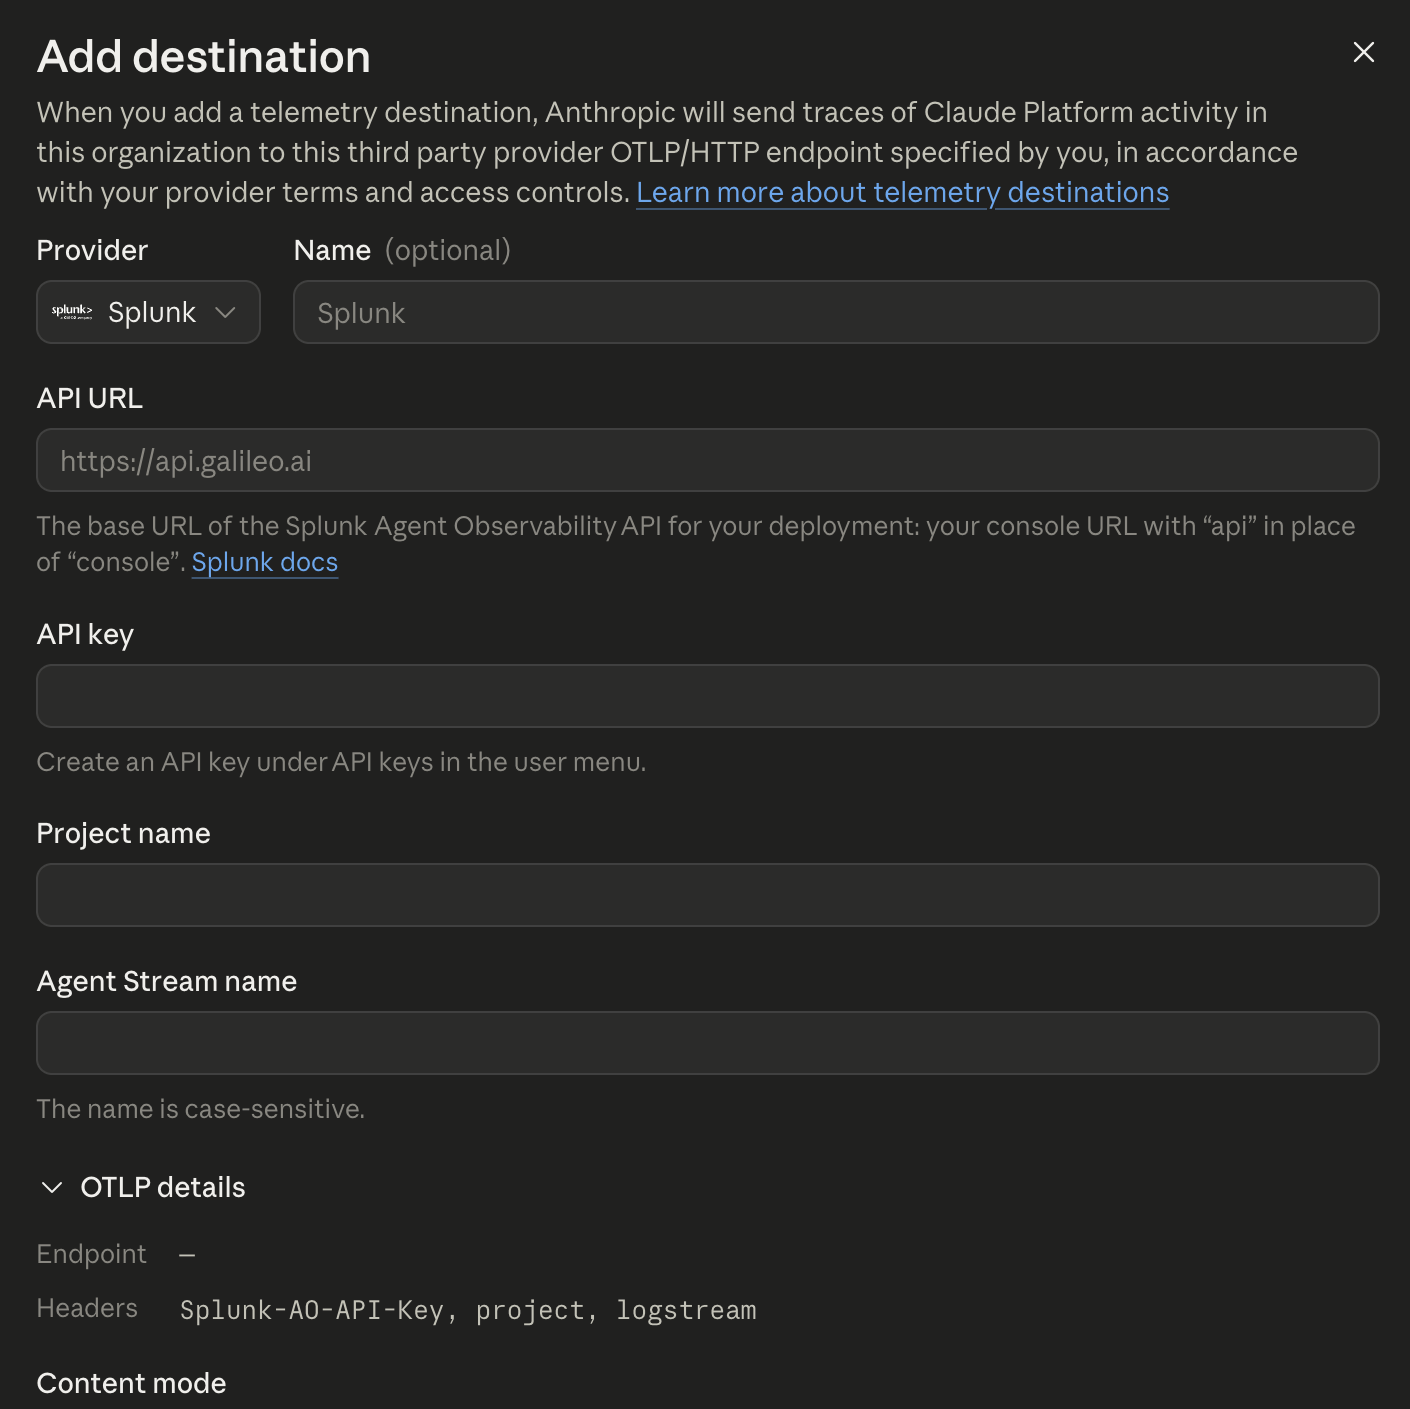
https://api.galileo.ai/otel/v1/traces. For a backend with a different trace path, enter its complete URL in Advanced > OTLP traces endpoint URL. Save the destination and ensure it is enabled. Learn more at the Destination configuration reference.
Enter the API key, Project name, and Agent Stream name for your deployment. The OTLP details are write-only and are hidden after saving. Set the Content mode as Full content to include message and tool content in the traces.
Create an example agent and trigger traces
-
Open Managed Agents > Agents in your chosen workspace and create an agent named
calculator-demo. See Build in Console. - Choose an available Claude model and enter this system prompt: “You are an arithmetic assistant. Use the bash tool to calculate arithmetic requests. Report the result and the tool you used.” See Agent configuration fields.
-
Enable the built-in tools, including
bash, and select a cloud environment. See Tools and Cloud environment setup. - Create a deployment with a Manual trigger and this initial message: “Use the bash tool to calculate 17 x 23, then reply with the result and the tool you used.”
- Save the deployment and select Run now. For the corresponding API operation, see Trigger a manual run.
-
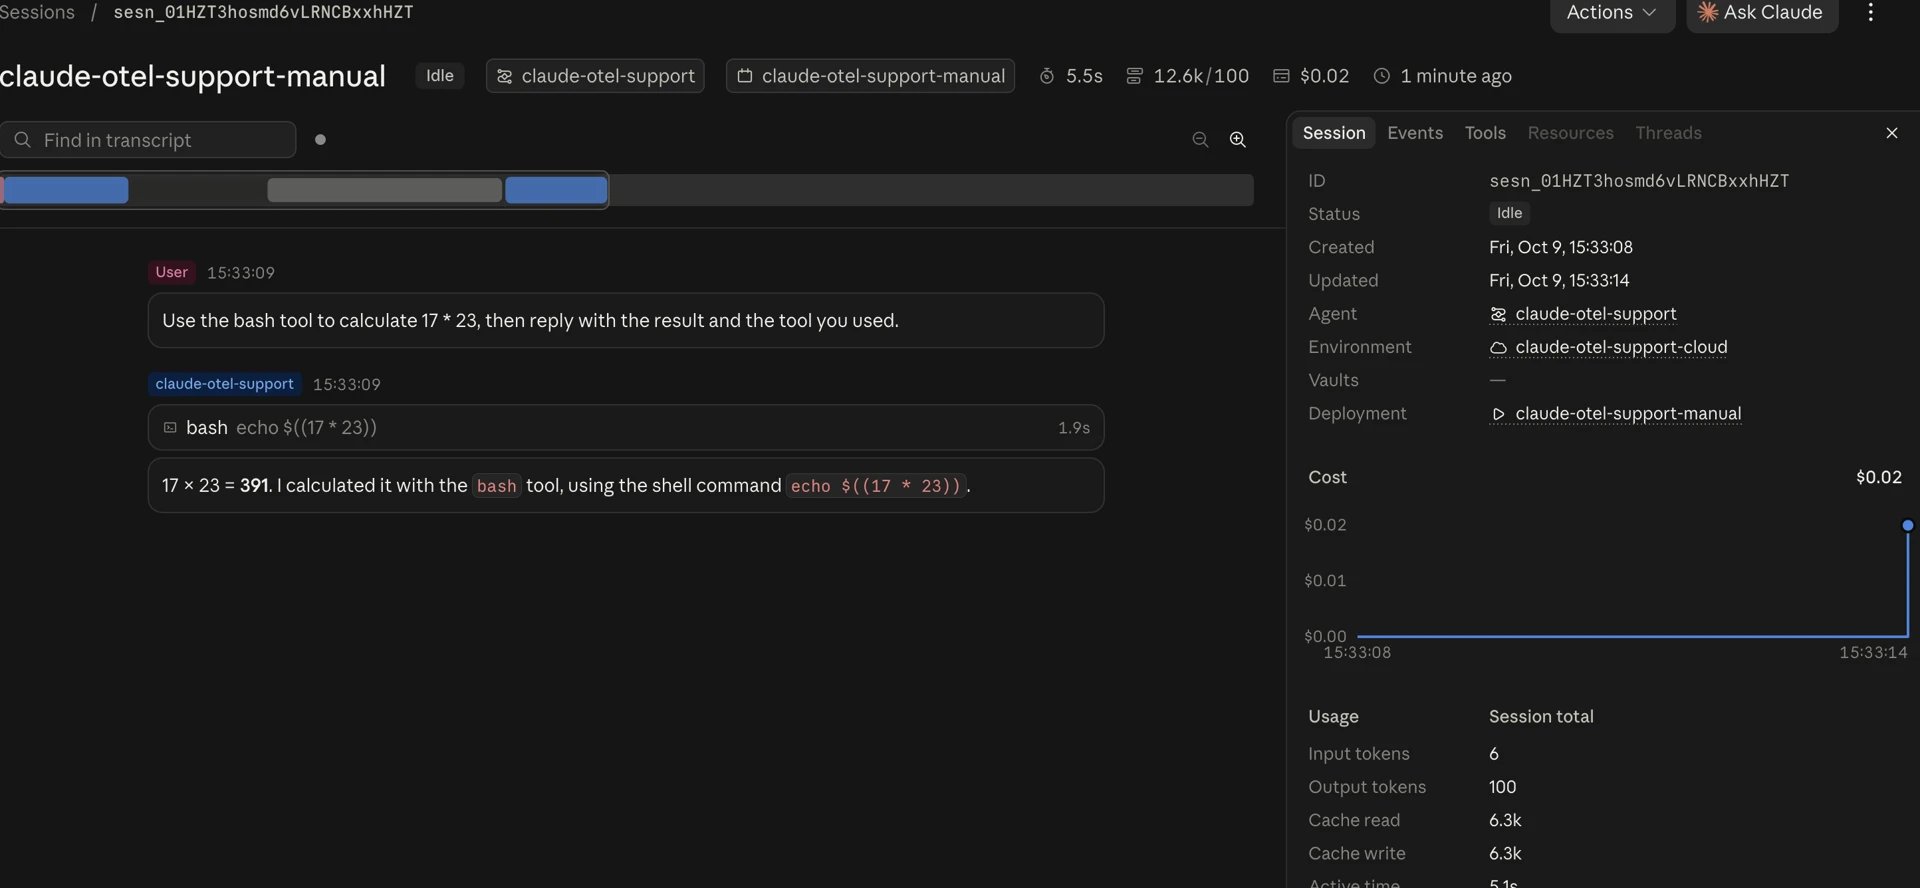
Open the resulting session. Confirm that the agent called
bashand returned 391. See Inspect sessions and track usage.

Explore the agent activity in Splunk Agent Observability
After the run, check in the Claude Console that the destination’s Delivery column shows Healthy. This can take about a minute. In Splunk Agent Observability, open the configured project and Agent Stream, then find the logged sessions, traces, and spans in the Tracing tab. The calculator demo illustrates a typical sequence: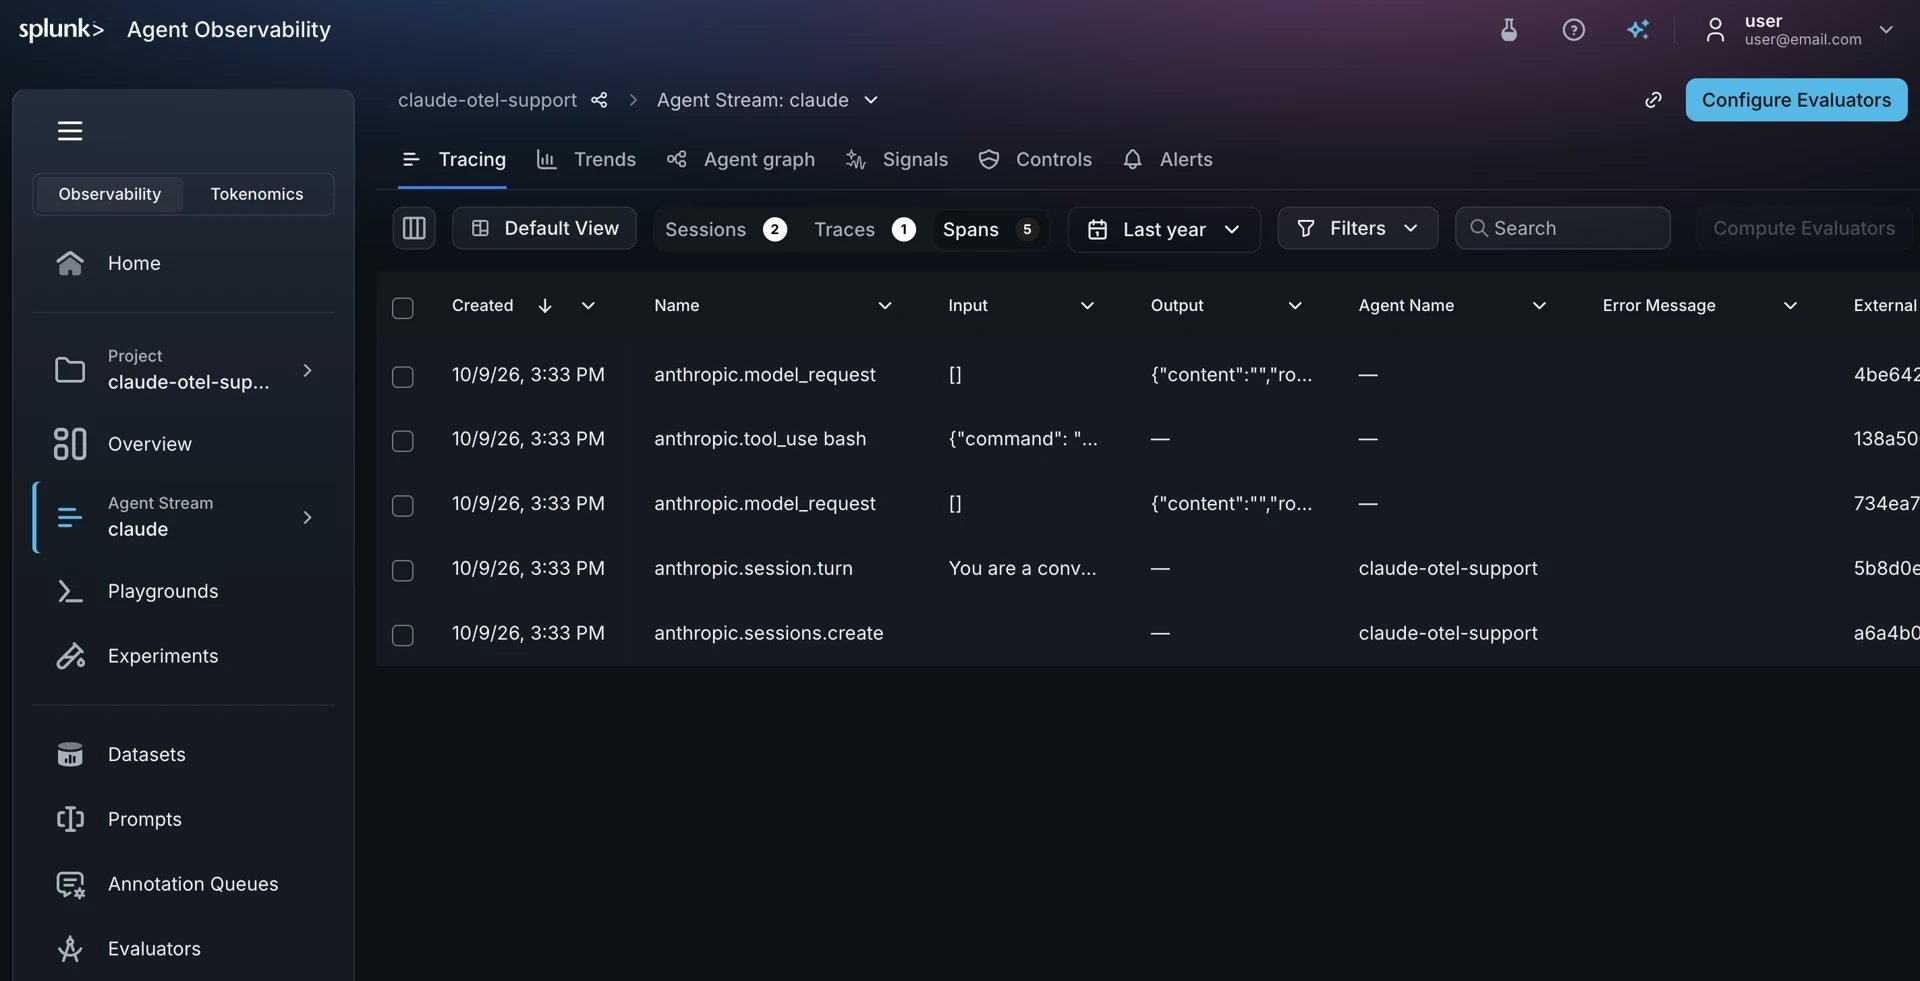
anthropic.session.id when a session contains activity across multiple traces. Learn more in the Managed Agents trace reference.
Platform tracing captures Claude managed operations. Additional instrumentation in your Python or other application code can add spans for processing inside a tool. Learn more about installing the Claude SDK.