

LLM integration prerequisite
To run an experiment using a prompt and a dataset, you need to set up an LLM integration. An integration is also required for experiments using out-of-the-box evaluators and custom LLM evaluators. More information on configuring an LLM integration is available in this getting started guide. Enterprise customers also have the option of setting up Luna small language models (SLMs) for experiments.Experiment flow
A primary entry point for running experiments is the functionrun_experiment in the Python SDK.
The flow diagram below illustrates what happens after calling this function.
The table below describes the different approaches (e.g. function parameters) that can be involved in setting up an experiment.
You can choose evaluators for your experiments. Evaluators can be out-of-the-box evaluators (specified as constants in the Splunk Agent Observability SDK), or the names of custom evaluators.
For advanced users — If you’re calling your application code from an experiment, the experiment runner will start a new session and trace for every row in your dataset. To avoid conflicts, you will need to ensure your application code doesn’t start a new session or trace manually, or conclude or flush the trace.Visit the examples in this section to check whether an experiment is in progress. This special handling is required for application code that uses manual logging (e.g.
SplunkAOLogger), it is not necessary for application code using the log wrapper.Run experiments with prompt template
A simple way to get started with experimentation is by evaluating prompts against datasets. This is especially valuable during the initial prompt development and refinement phase, where you want to test different prompt variations. Assuming you’ve previously created a dataset, you can use the following code to run an experiment:Run experiments with generated output
As of Splunk Agent Observability Python SDK v1.50.1+ — Bring your own data from any system (production logs, external LLMs, or manual curation) and evaluate it directly.
- Evaluating production output: Export traces from your live system, run quality evaluators to find issues
- Comparing model providers: Collect output from OpenAI, Anthropic, and Gemini offline, then score them all in Splunk Agent Observability
- Regression testing: After improving your RAG pipeline, run the same evaluators on new output to see if scores improved
- A/B testing: Run the same inputs through two different systems, put both outputs in datasets, compare evaluator scores
How it works
- Create a dataset with an
inputcolumn and agenerated_outputcolumn - Call
run_experimentwithout aprompt_template— Splunk Agent Observability detects thegenerated_outputcolumn automatically - Evaluators are computed directly on the existing output — no LLM calls needed for generation
Example
This flow is currently supported in the Python SDK (v1.50.1+).
Python
Using this flow
You can use this flow in two ways:- Already have a Splunk Agent Observability dataset? Pass it directly to
run_experiment(...). - Have local Python data (e.g., a list of dictionaries)? First upload it with
create_dataset(...), then pass the returned dataset torun_experiment(...).
Dataset columns
Your dataset needs at minimum aninput column and a generated_output column.
Column naming — The SDK accepts both
ground_truth and output for the reference/expected answer column. Internally they map to the same field. In the Splunk Agent Observability UI and CSV exports, this column is displayed as “Ground Truth”. We recommend using ground_truth in new datasets for clarity.Flow determination
When you callrun_experiment:
- If you provide a
prompt_template, the prompt-driven flow is always used (even if the dataset has agenerated_outputcolumn). - If you omit
prompt_templateand the dataset has agenerated_outputcolumn with at least one non-empty value in the first 100 rows, the generated output flow is used. - If you omit
prompt_templateand the dataset has nogenerated_outputcolumn, or the column exists but has no non-empty values in the sampled rows, an error is returned.
Run experiments with custom function
Once you’re comfortable with basic prompt testing, you might want to evaluate more complex parts of your app using your datasets. This approach is particularly useful when you have a generation function in your app that takes a set of inputs, which you can model with a dataset. If your experiment runs code that uses thelog decorator, or a third-party SDK integration, then all the spans created by these will be logged to the experiment.
This example uses the log decorator. The workflow span created by the log decorator will be logged to the experiment.
Run experiments against complex code with custom functions
Custom functions can be as complex as required, including multiple steps, agents, RAG, and more. This means you can build experiments around an existing application, allowing you to run experiments against the full application you have built, using datasets to mimic user inputs. For example, if you have a multi-agent LangGraph chatbot application, you can run an experiment against it using a dataset to define different user inputs, and log every stage in the agentic flow as part of that experiment. To enable this, you will need to make some small changes to your application logic to handle the logging context from the experiment. When functions in your application are run by therun_experiment call, a logger is created by the experiment runner, and a trace is started. This logger can be passed through the application, accessed using the @log decorator or by calling splunk_ao_context.get_logger_instance() in Python.
You will need to change your code to use this instead of creating a new logger and starting a new trace.
Get an existing logger and check for an existing trace
The Splunk Agent Observability SDK maintains a context that tracks the current logger. You can get this logger with the following code:Using third-party integrations with experiments
If you are using third-party integrations, there may be some configuration you need to do to make the integrations work with experiments. See the following documentation for more details:Custom function logging principles
There are a few important principles to understand when logging experiments in code.- When running an experiment, a new logger is created for you and set in the Splunk Agent Observability context. If you create a new logger manually in the application code used in your experiment, this logger will not be used in the experiment.
- To access the logger to manually add traces inside the experiment code, you can call
splunk_ao_context.get_logger_instance()(Python) to get the current logger. - To detect if there is an active trace, use the
current_parent()(Python) method on the logger. This will returnNone/undefinedif there isn’t an active trace. - Be sure to handle cases in your application code where a logger is created or a trace is started, and make sure this doesn’t happen in an experiment, and the experiment logger and trace is used instead.
- Every row in a dataset is a new trace. If you create new traces manually, they will not be used.
- Do not conclude or flush the logger in your experiment, the experiment will do this for you.
Set evaluators for your experiment
When you run an experiment, you need to define which evaluators you want to use for each row in the dataset. For out-of-the-box evaluators, use the constants provided by the Splunk Agent Observability SDK."Compliance - do not recommend any financial actions":

Ground truth
For Ground Truth Adherence, you also need to set the ground truth in your dataset. This is set in theground_truth column.
If you set the
ground_truth column when using other evaluators, the value is not used in the calculation of the evaluator, but can be added to the Splunk Agent Observability UI under the “Dataset Ground Truth” column. This can be helpful for manual review.Custom dataset evaluation
As your testing needs become more specific, you might need to work with custom or local datasets. This approach is perfect for focused testing of edge cases or when building up your test suite with specific scenarios:Custom evaluators for deep analysis
For the most sophisticated level of testing, you might need to track specific aspects of your application’s behavior. Custom evaluators provide the flexibility to define precisely what you want to measure, enabling deep analysis and targeted improvement:Experiments with agentic and RAG applications
The experimentation framework extends naturally to more complex applications like agentic AI systems and RAG (Retrieval-Augmented Generation) applications. When working with agents, you can evaluate various aspects of their behavior, from decision-making capabilities to tool usage patterns. This is particularly valuable when testing how agents handle complex workflows, multi-step reasoning, or tool selection. For RAG applications, experimentation helps validate both the retrieval and generation components of your system. You can assess the quality of retrieved context, measure response relevance, and ensure that your RAG pipeline maintains high accuracy across different types of queries. This is especially important when fine-tuning retrieval parameters or testing different reranking strategies. The same experimentation patterns shown above apply to these more complex systems. You can use predefined datasets to benchmark performance, create custom datasets for specific edge cases, and define specialized evaluators that capture the unique aspects of agent behavior or RAG performance. This systematic approach to testing helps ensure that your advanced AI applications maintain high quality and reliability in production environments.Multi-turn conversations in experiments
The Python SDK supports evaluating multi-turn conversations in experiments. With this feature, you can use session evaluators to test how multi-turn datasets perform on your agents before deploying changes to production.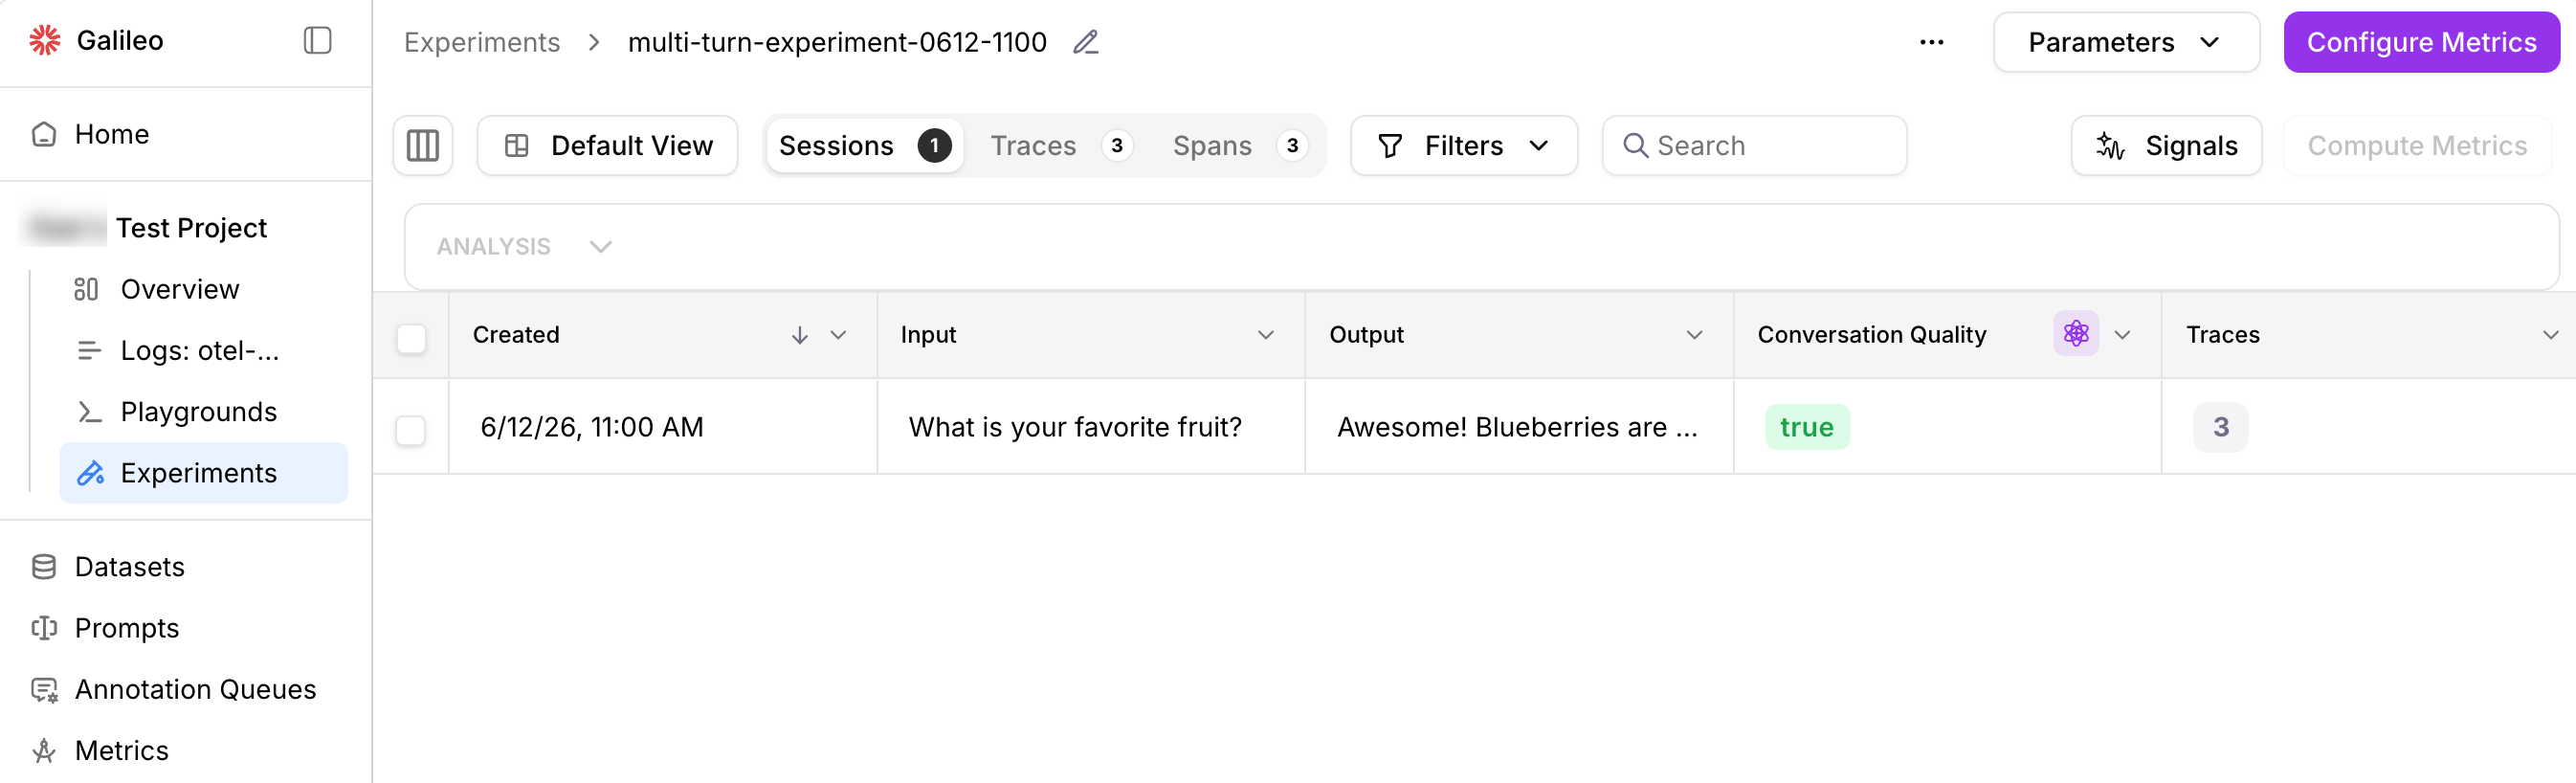
- Define multi-turn datasets and experiments using the Python SDK.
- Configure out-of-the-box or custom session evaluators on these experiments.
- View the sessions and evaluators in the Experiments UI in a new “Sessions” tab — or get the computed evaluator values through the SDK.
Instead of
run_experiment, set up multi-turn experiments with create_experiment. This function creates an experiment object in which to provide your own sessions and traces using the Splunk Agent Observability context and logger.See this code example for more information.Experiment groups
You can organize related experiments into experiment groups. In the Python SDK, provide an optionalexperiment_group parameter on run_experiment, create_experiment, or get_experiments. Use list_experiment_groups to show available experiment groups.
Learn more about grouping experiments in the Splunk Agent Observability UI and SDK on this page.
Best practices
- Use consistent datasets: Use the same dataset when comparing different prompts or models to ensure fair comparisons.
- Test multiple variations: Run experiments with different prompt variations to find the best approach.
- Use appropriate evaluators: Choose evaluators that are relevant to your specific use case.
- Start small: Begin with a small dataset to quickly iterate and refine your approach before scaling up.
- Document your experiments: Keep track of what you’re testing and why to make it easier to interpret results.
Next steps
Experiments SDK
Use Datasets in Code
Learn about more datasets, the data driving your experiments.
Prompt Templates
Learn how to create and use prompt templates in experiments
Evaluators
Evaluators Reference Guide
A list of supported evaluators and how to use them in experiments.
Local Evaluators
Create and run custom evaluators directly in code.
Custom Code-Based Evaluators
Create reusable custom evaluators right in the Splunk Agent Observability UI.
Custom LLM-as-a-Judge Evaluators
Create reusable custom evaluators using LLMs to evaluate your response quality