

Distributed Traces in the Splunk Agent Observability UI
Inputs and outputs from distributed traces are combined into one view in the UI.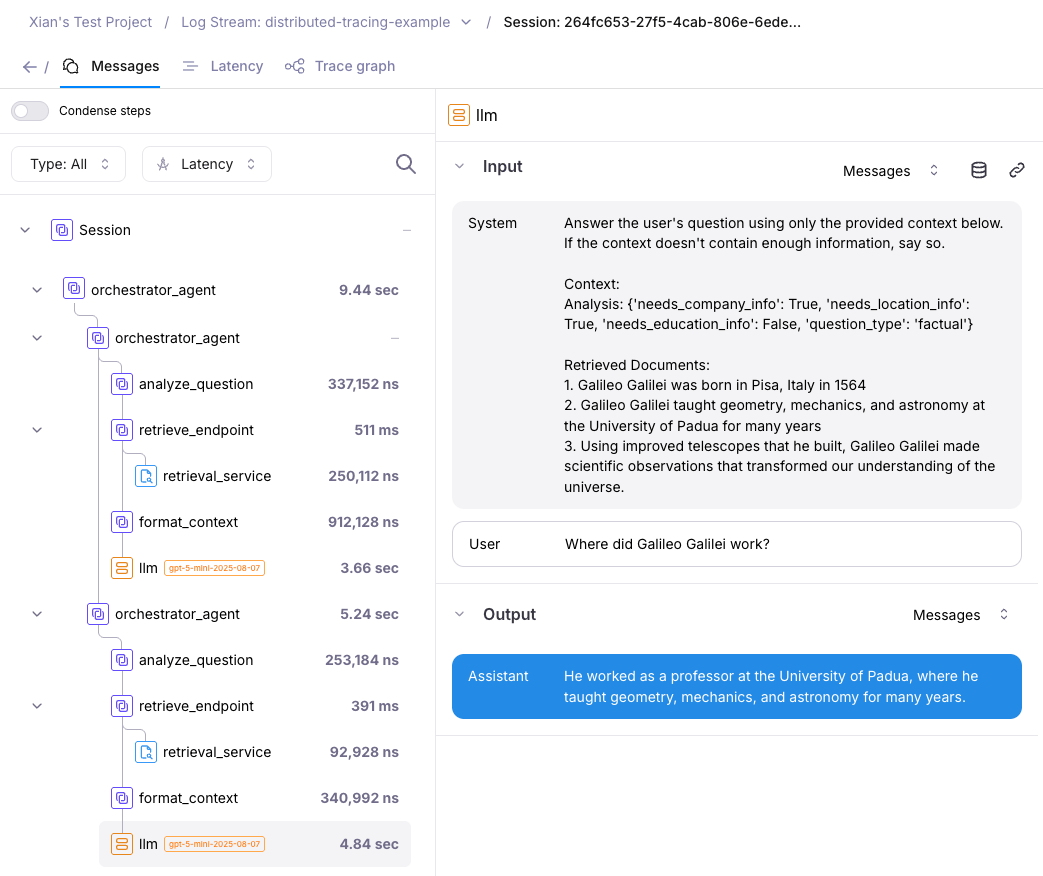
- Retrieval Service: A FastAPI service running on port 8000 that handles information retrieval.
- Orchestrator Service: The main client that coordinates the RAG pipeline by calling the retrieval service.
Example: Two-service RAG pipeline
A code example of setting up Distributed Tracing is available in the DT 2.0 directory of thesplunk-ao Python SDK repository.
This code example follows a client-server model where:
- Client starts a trace
- Client makes HTTP requests to one or more server(s)
- Server processes the request and reports back to the client
- Client concludes the trace
How to enable distributed tracing
Distributed tracing uses standard W3C Trace Context propagation. The SDK can configure the supported HTTP instrumentors once during application startup.aiohttp clients. Passing a FastAPI
or Starlette app also enables inbound trace-context extraction.
The application owns the returned provider and should call provider.shutdown()
when the process is shutting down.
Manual propagation
Manual propagation remains available for unsupported transports or applications that need direct control. Add the W3C headers to an outbound request:Starlette-based server. Install
the middleware extra first:
configure_distributed_tracing(app=app), do not add
TracingMiddleware; FastAPI and Starlette inbound propagation is configured
automatically.
Other OpenTelemetry instrumented frameworks
For Flask, Django, and other frameworks, use the framework’s OpenTelemetry instrumentor with a provider configured withadd_splunk_ao_span_processor().
Configure the instrumentor to use that provider, and follow its documentation for inbound W3C context extraction.
Install the base SDK and the OpenTelemetry instrumentor for your framework
before configuring the provider:
provider, following the framework
instrumentor’s documentation.
Do not combine automatic instrumentation and manual propagation for the same
transport.
Troubleshooting Tips
Traces not linking across services?- With automatic instrumentation, verify that the client transport and the server application were both configured during startup. Each process owns its own provider.
- With manual propagation, verify that
get_tracing_headers()is added to the outbound request and that the server extracts the W3C context. - Check that both services use the same project and Agent Stream configuration.
- Keep the provider alive until the work completes and call
provider.shutdown()during application shutdown so completed spans can be drained. - Do not add per-trace flush calls; the SDK uses the normal OpenTelemetry batch processor for completed spans.