

traceparent header carries the trace context across the wire. Splunk Agent Observability joins all spans that share a trace ID into a single trace.
If both services are Python and use the Splunk Agent Observability SDK directly, Distributed Tracing is simpler. Use the OpenTelemetry approach when your services use different agent frameworks (Microsoft Agent Framework, Google ADK, LangChain, etc.) or different languages.
What you’ll see in Splunk Agent Observability
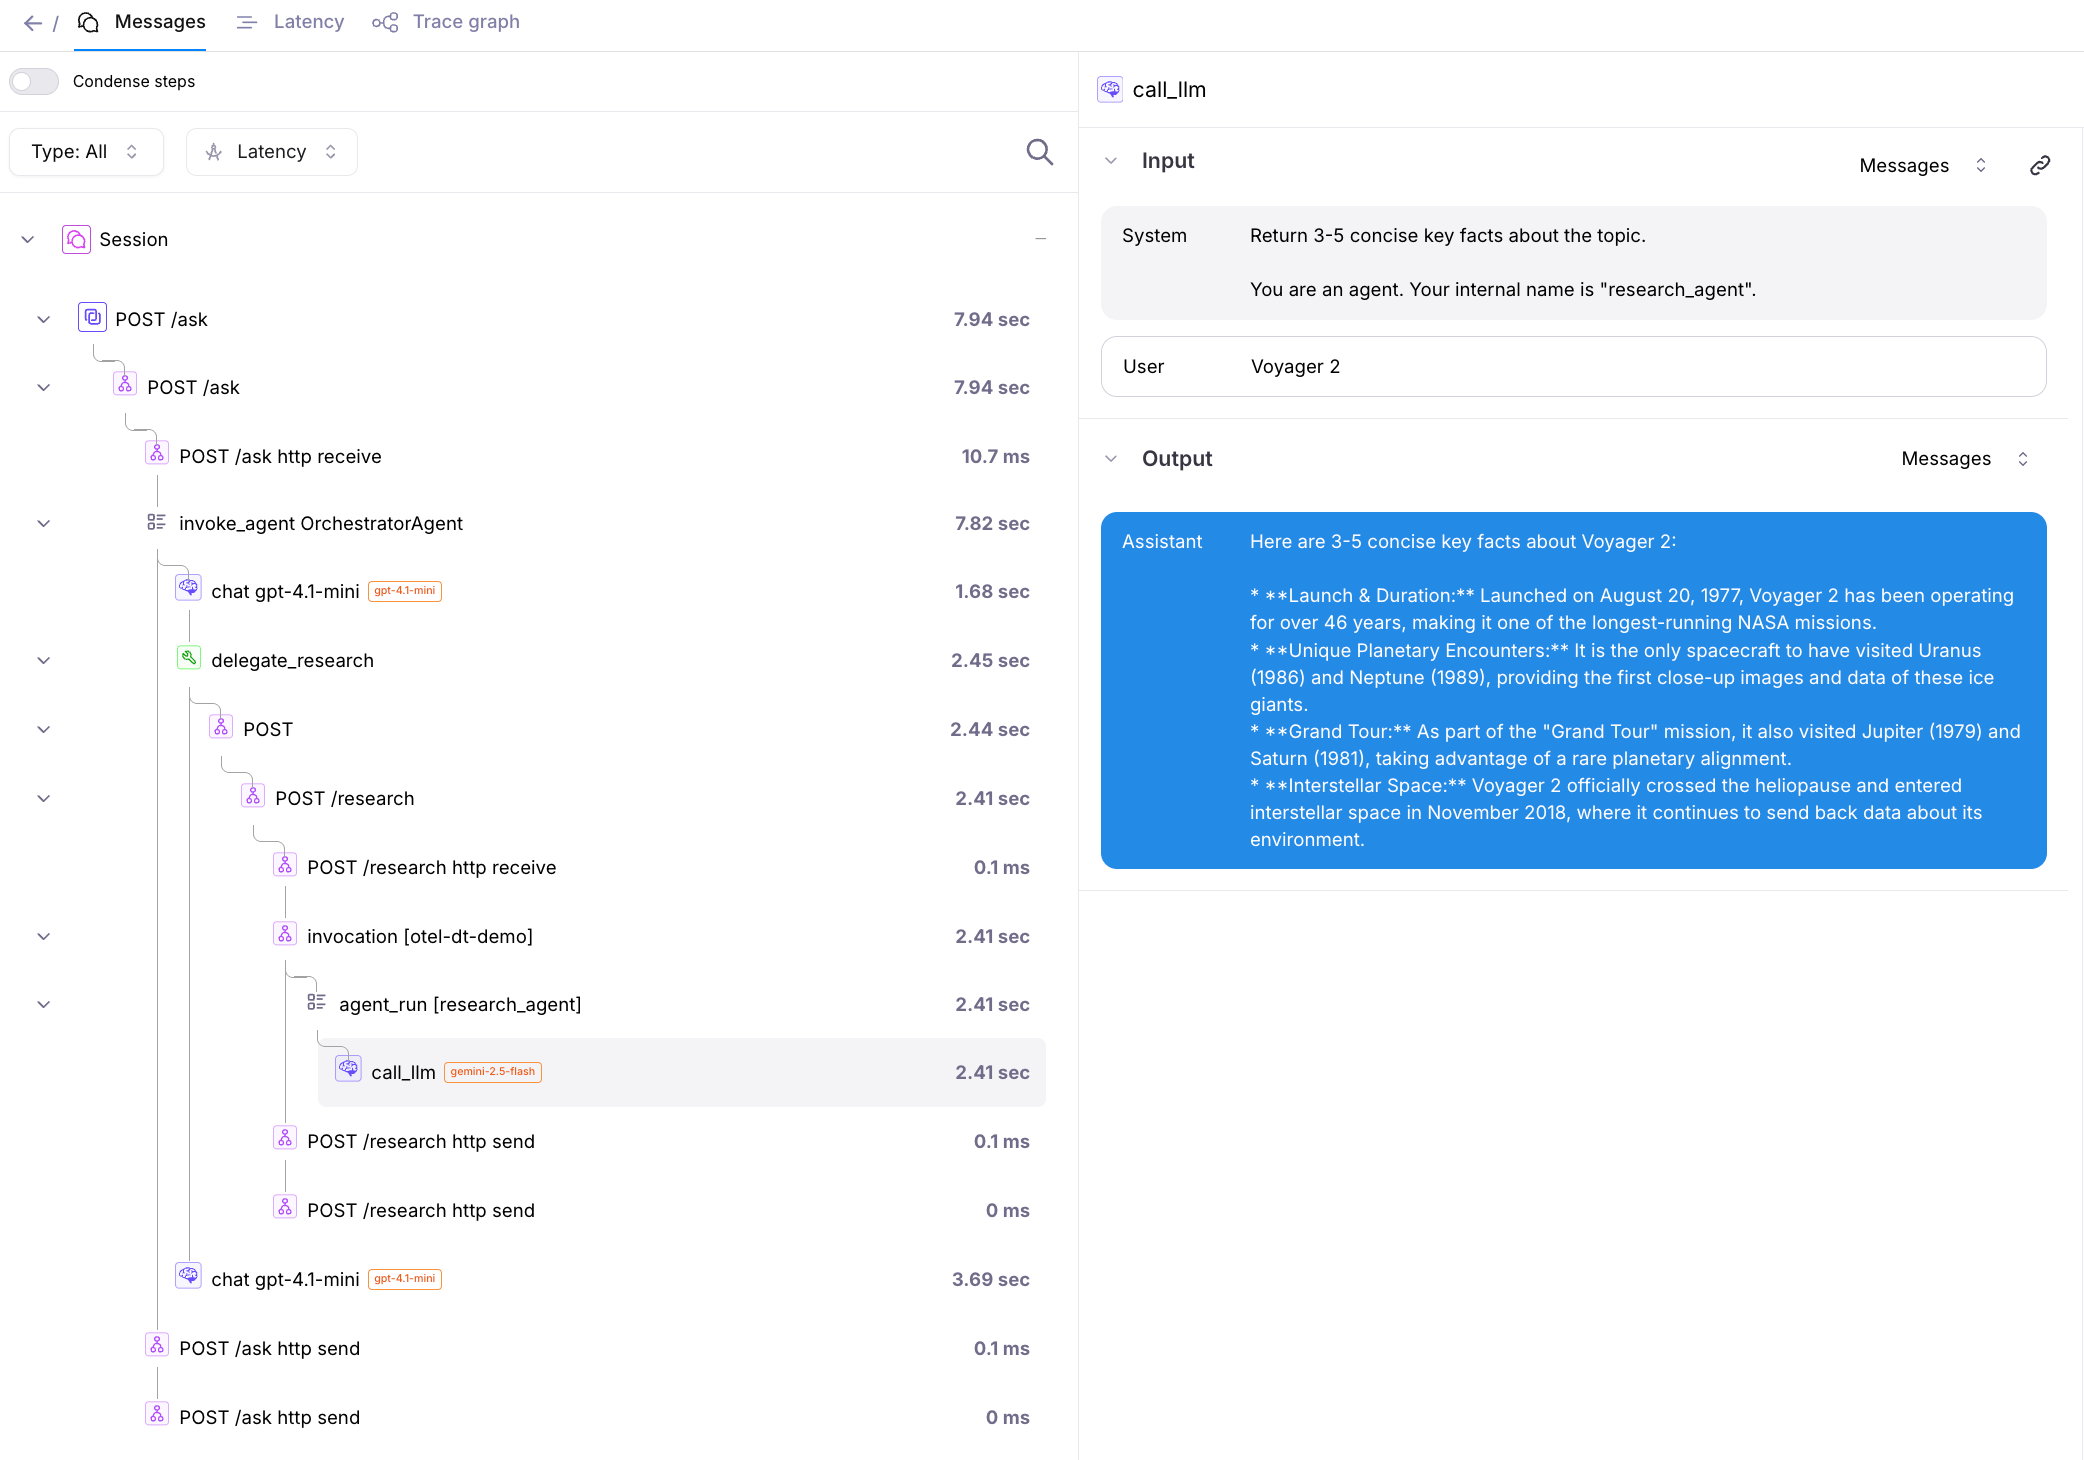
A single user request to Agent A that delegates to Agent B produces one trace:Setup
.env
requirements.txt
SplunkAOSpanProcessor reads the deployment credentials and routing values from the environment and exports OTLP directly to the Splunk Agent Observability OpenTelemetry endpoint. No collector is required.
For on-premises deployments, SPLUNK_AO_CONSOLE_URL is required and the optional SPLUNK_AO_API_URL can
override the API base URL; the SDK appends /otel/v1/traces.
Agent A: Microsoft Agent Framework, calls Agent B
agent_a.py
Agent B: Google ADK research agent
agent_b.py
Run it
otel-distributed-tracing project in Splunk Agent Observability, then open the default Agent Stream. You’ll see one trace covering both agents:
On-premises Splunk Agent Observability
This section applies to on-premises, standalone, and custom deployments. The OTel endpoint is different from Splunk Agent Observability’s regular API endpoint and is specifically designed to receive telemetry data in the OTLP format. If you are using:-
A SaaS deployment integrated with Splunk Observability Cloud, then you don’t need to provide a custom OTel endpoint. The SDK automatically derives the
https://ingest.<realm>.observability.splunkcloud.com/v2/trace/otlpendpoint fromSPLUNK_AO_REALM. -
An on-premises, standalone, or custom deployment, replace the
<your-splunk-ao-api-url>/otel/v1/tracesendpoint with your deployment URL. The format of this URL is based on your console URL, appending/otel/v1/traces.
SPLUNK_AO_API_URL in .env; SplunkAOSpanProcessor picks it up automatically and appends
/otel/v1/traces.
Related
- Distributed Tracing: Splunk Agent Observability’s native Python SDK distributed mode.
- Microsoft Agent Framework integration
- Google ADK (OpenTelemetry) integration