

Overview
This guide walks you through running a LangGraph app with:- OpenTelemetry tracing
- OpenInference semantic conventions
- Splunk Agent Observability’s built-in span processor
- Automatic LangGraph + OpenAI instrumentation
- Takes a user question
- Validates the input
- Sends the question to OpenAI
- Parses/cleans the LLM response
- Returns a final formatted answer
- Emits detailed traces for every step
In this guide you will
- Set up your environment and requirements
- Understanding and running the LangGraph Open Telemetry SDK example
- Run your application with OpenTelemetry
Before you start
Below, you’ll find instructions on the key parts that come into play when using OpenTelemetry for observability.- Python 3.10+ installed
- A free Splunk Agent Observability account and API key
- An OpenAI API key
- Basic understanding of LangGraph concepts
- Familiarity with OpenTelemetry basics
Set up your environment and requirements
For this how-to guide we’ll assume that you have some familiarity with LangGraph, as well as some familiarity with basic observability principles. To follow this guide pull the code from the LangGraph Open Telemetry SDK example and work in the root of that directory.1
Install required dependencies
The corresponding repository
ships with a pyproject.toml
and so uv is recommended for this project.After installing uv,
you can create and sync a virtual environment with:
2
Set up environment variables
Create environment file or copy it from the
.env.example file
3
Self-hosted deployments: Set the OTel endpoint
The OTel endpoint is different from Splunk Agent Observability’s regular API endpoint and is specifically designed to receive telemetry data in the OTLP format.If you are using:
-
A SaaS deployment integrated with Splunk Observability Cloud, then you don’t need to provide a custom OTel endpoint. The SDK automatically derives the
https://ingest.<realm>.observability.splunkcloud.com/v2/trace/otlpendpoint fromSPLUNK_AO_REALM. -
An on-premises, standalone, or custom deployment, replace the
<your-splunk-ao-api-url>/otel/v1/tracesendpoint with your deployment URL. The format of this URL is based on your console URL, appending/otel/v1/traces.
OTEL_EXPORTER_OTLP_ENDPOINT environment variable. For example:Understanding and running the LangGraph Open Telemetry SDK example
1
Initialize OpenTelemetry and Splunk Agent Observability span processor
After setting up your environment variables, initialize
OpenTelemetry and create the
SplunkAOSpanProcessor. The
TracerProvider manages tracers and spans,
while the SplunkAOSpanProcessor is responsible for
exporting those spans to Splunk Agent Observability.2
Apply OpenInference instrumentation
Enable automatic AI observability by applying OpenInference instrumentors. These automatically capture LLM calls,
token usage, and model performance without requiring changes to your existing code.What this enables automatically:
- LangGraph operations and OpenAI API calls are traced
- Token usage and model information is captured
- Performance evaluators and errors are recorded
3
Define your LangGraph workflow
This example app will build a simple LangGraph workflow that:
- Validates user input with
validate_input - Calls OpenAI with
generate_response - Formats the final answer with
format_answer
4
Build and run the LangGraph application
Everything is assembled using LangGraph’s
StateGraph:5
Run the LangGraph application
Finally, run the LangGraph application to observe the traces in Splunk Agent Observability.
6
Run the full code example
Finally, run the LangGraph Open Telemetry SDK example
with:
7
Viewing your traces in Splunk Agent Observability
Once your application is running with OpenTelemetry configured, you can view your traces in the Splunk Agent Observability dashboard. Navigate to your project and Agent Stream to see the complete trace graph showing your LangGraph workflow execution.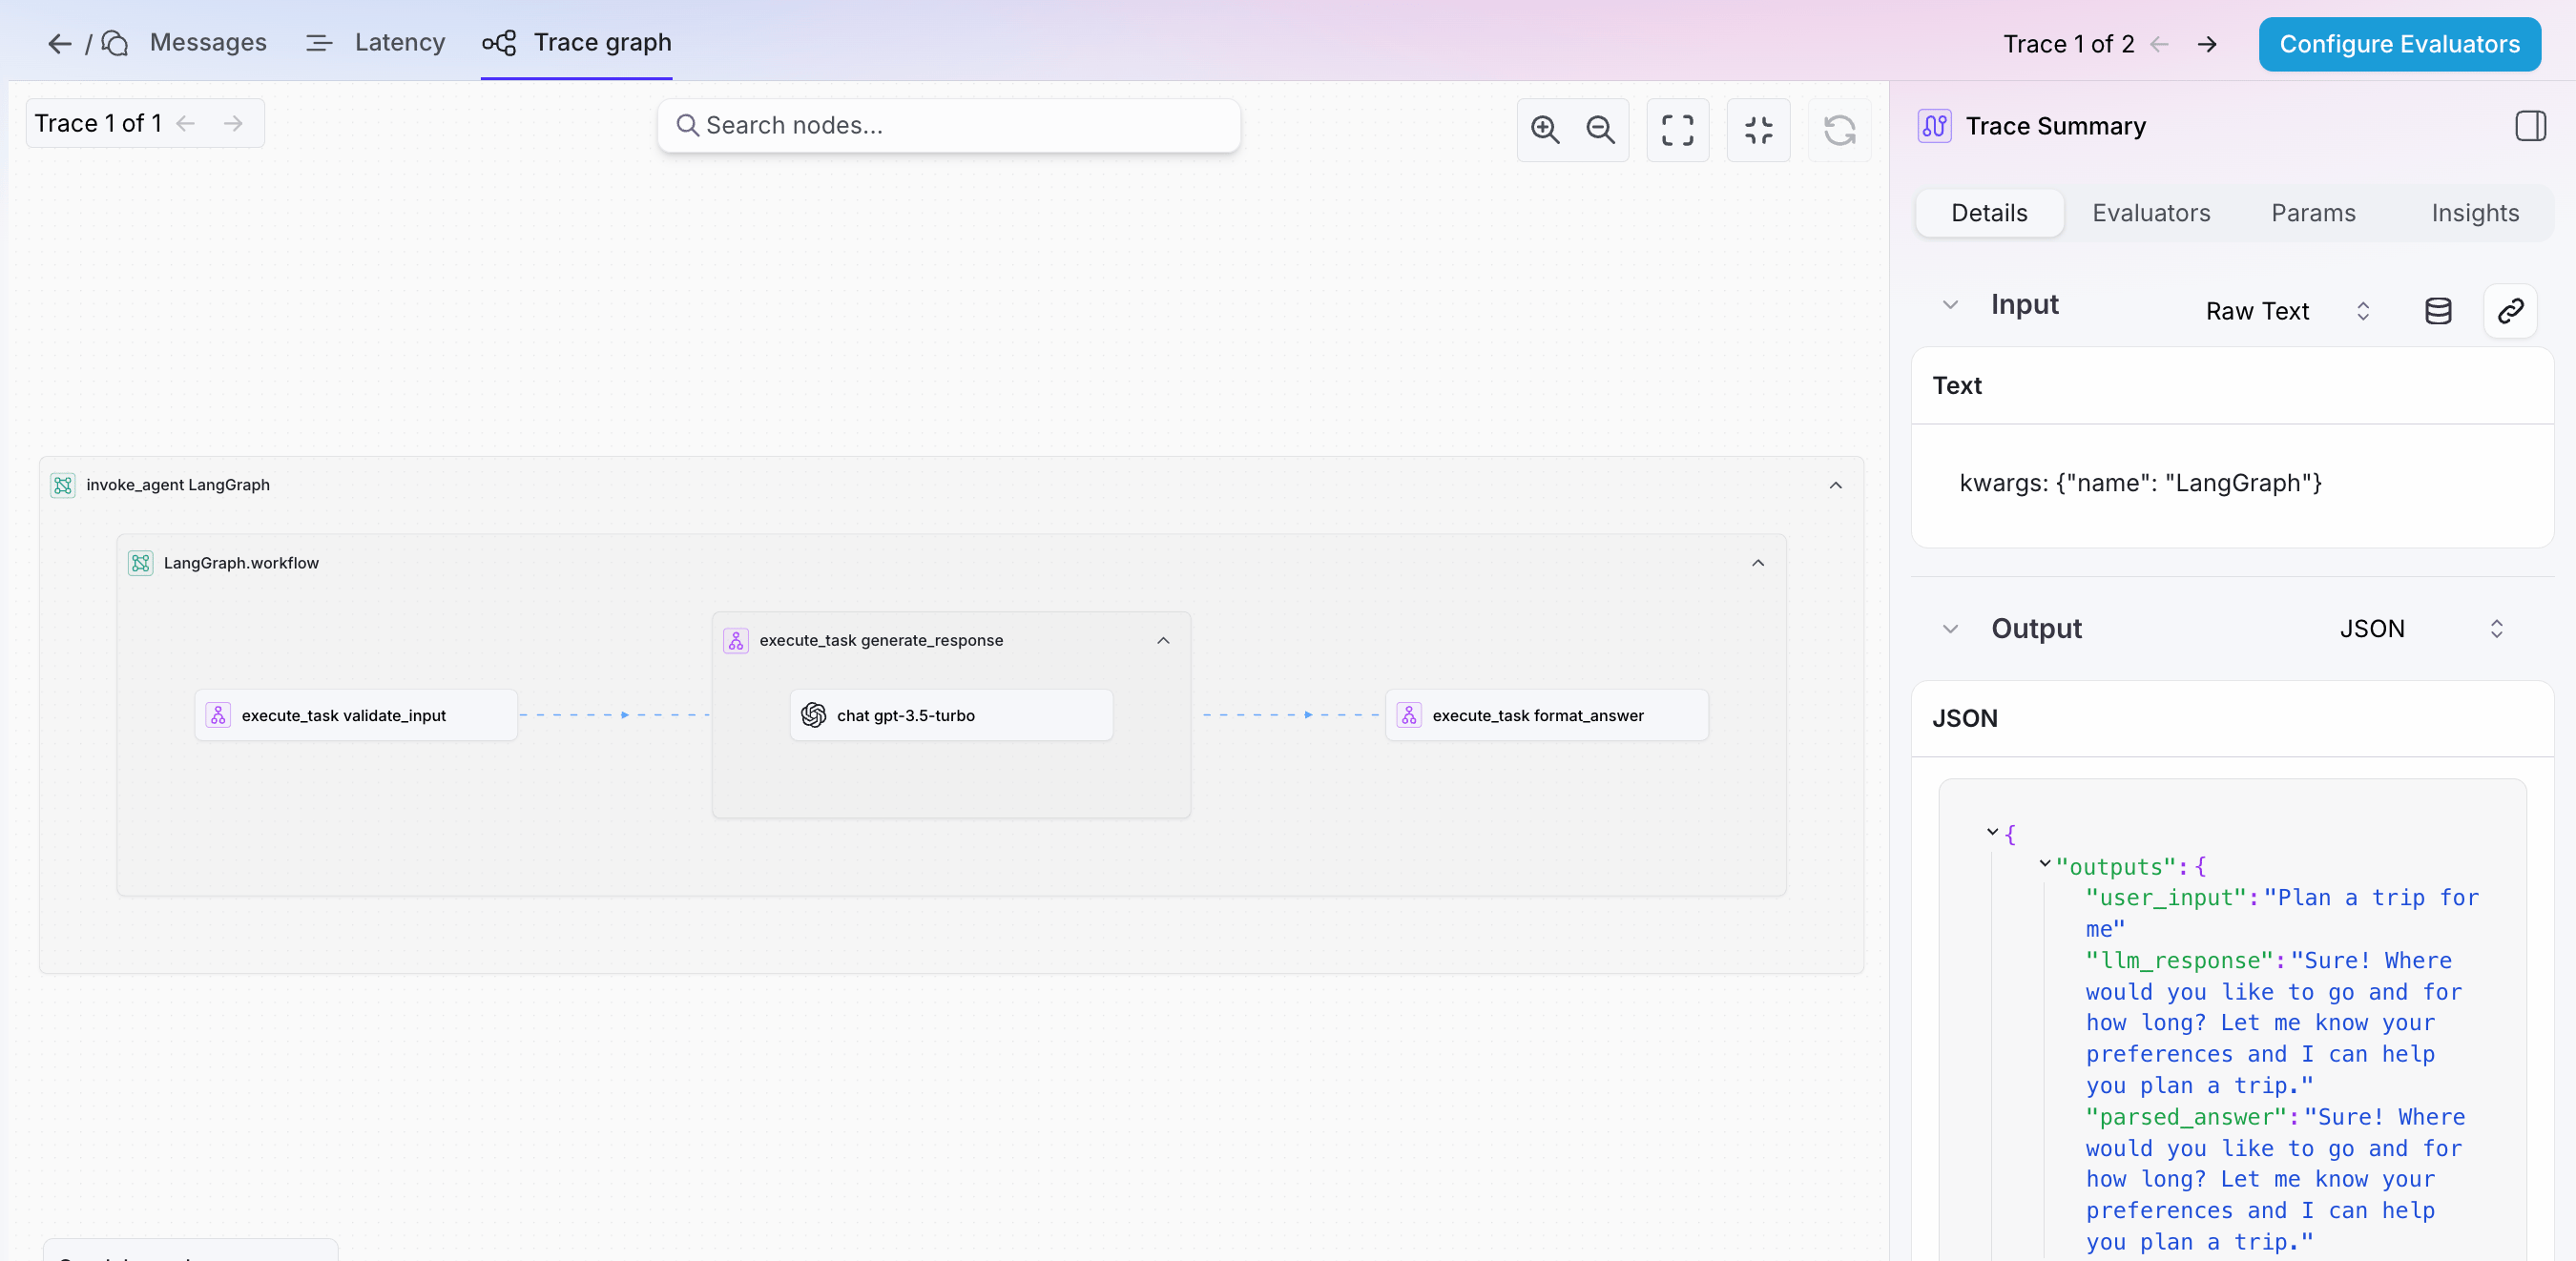
- Workflow spans showing the execution flow through your LangGraph nodes
- LLM call details with token usage and model information
- Performance evaluators including timing and resource utilization
- Error tracking if any issues occur during execution
Run your application with OpenTelemetry
With OpenTelemetry correctly configured, your application will now automatically capture and send observability data to Splunk Agent Observability with every run. You’ll see complete traces of your LangGraph workflows, detailed LLM call breakdowns with token counts, and performance insights organized by project and Agent Stream in your Splunk Agent Observability dashboard. This provides consistent, well-structured logging across all your AI applications without requiring additional code changes, enabling effective monitoring, debugging, and optimization at scale.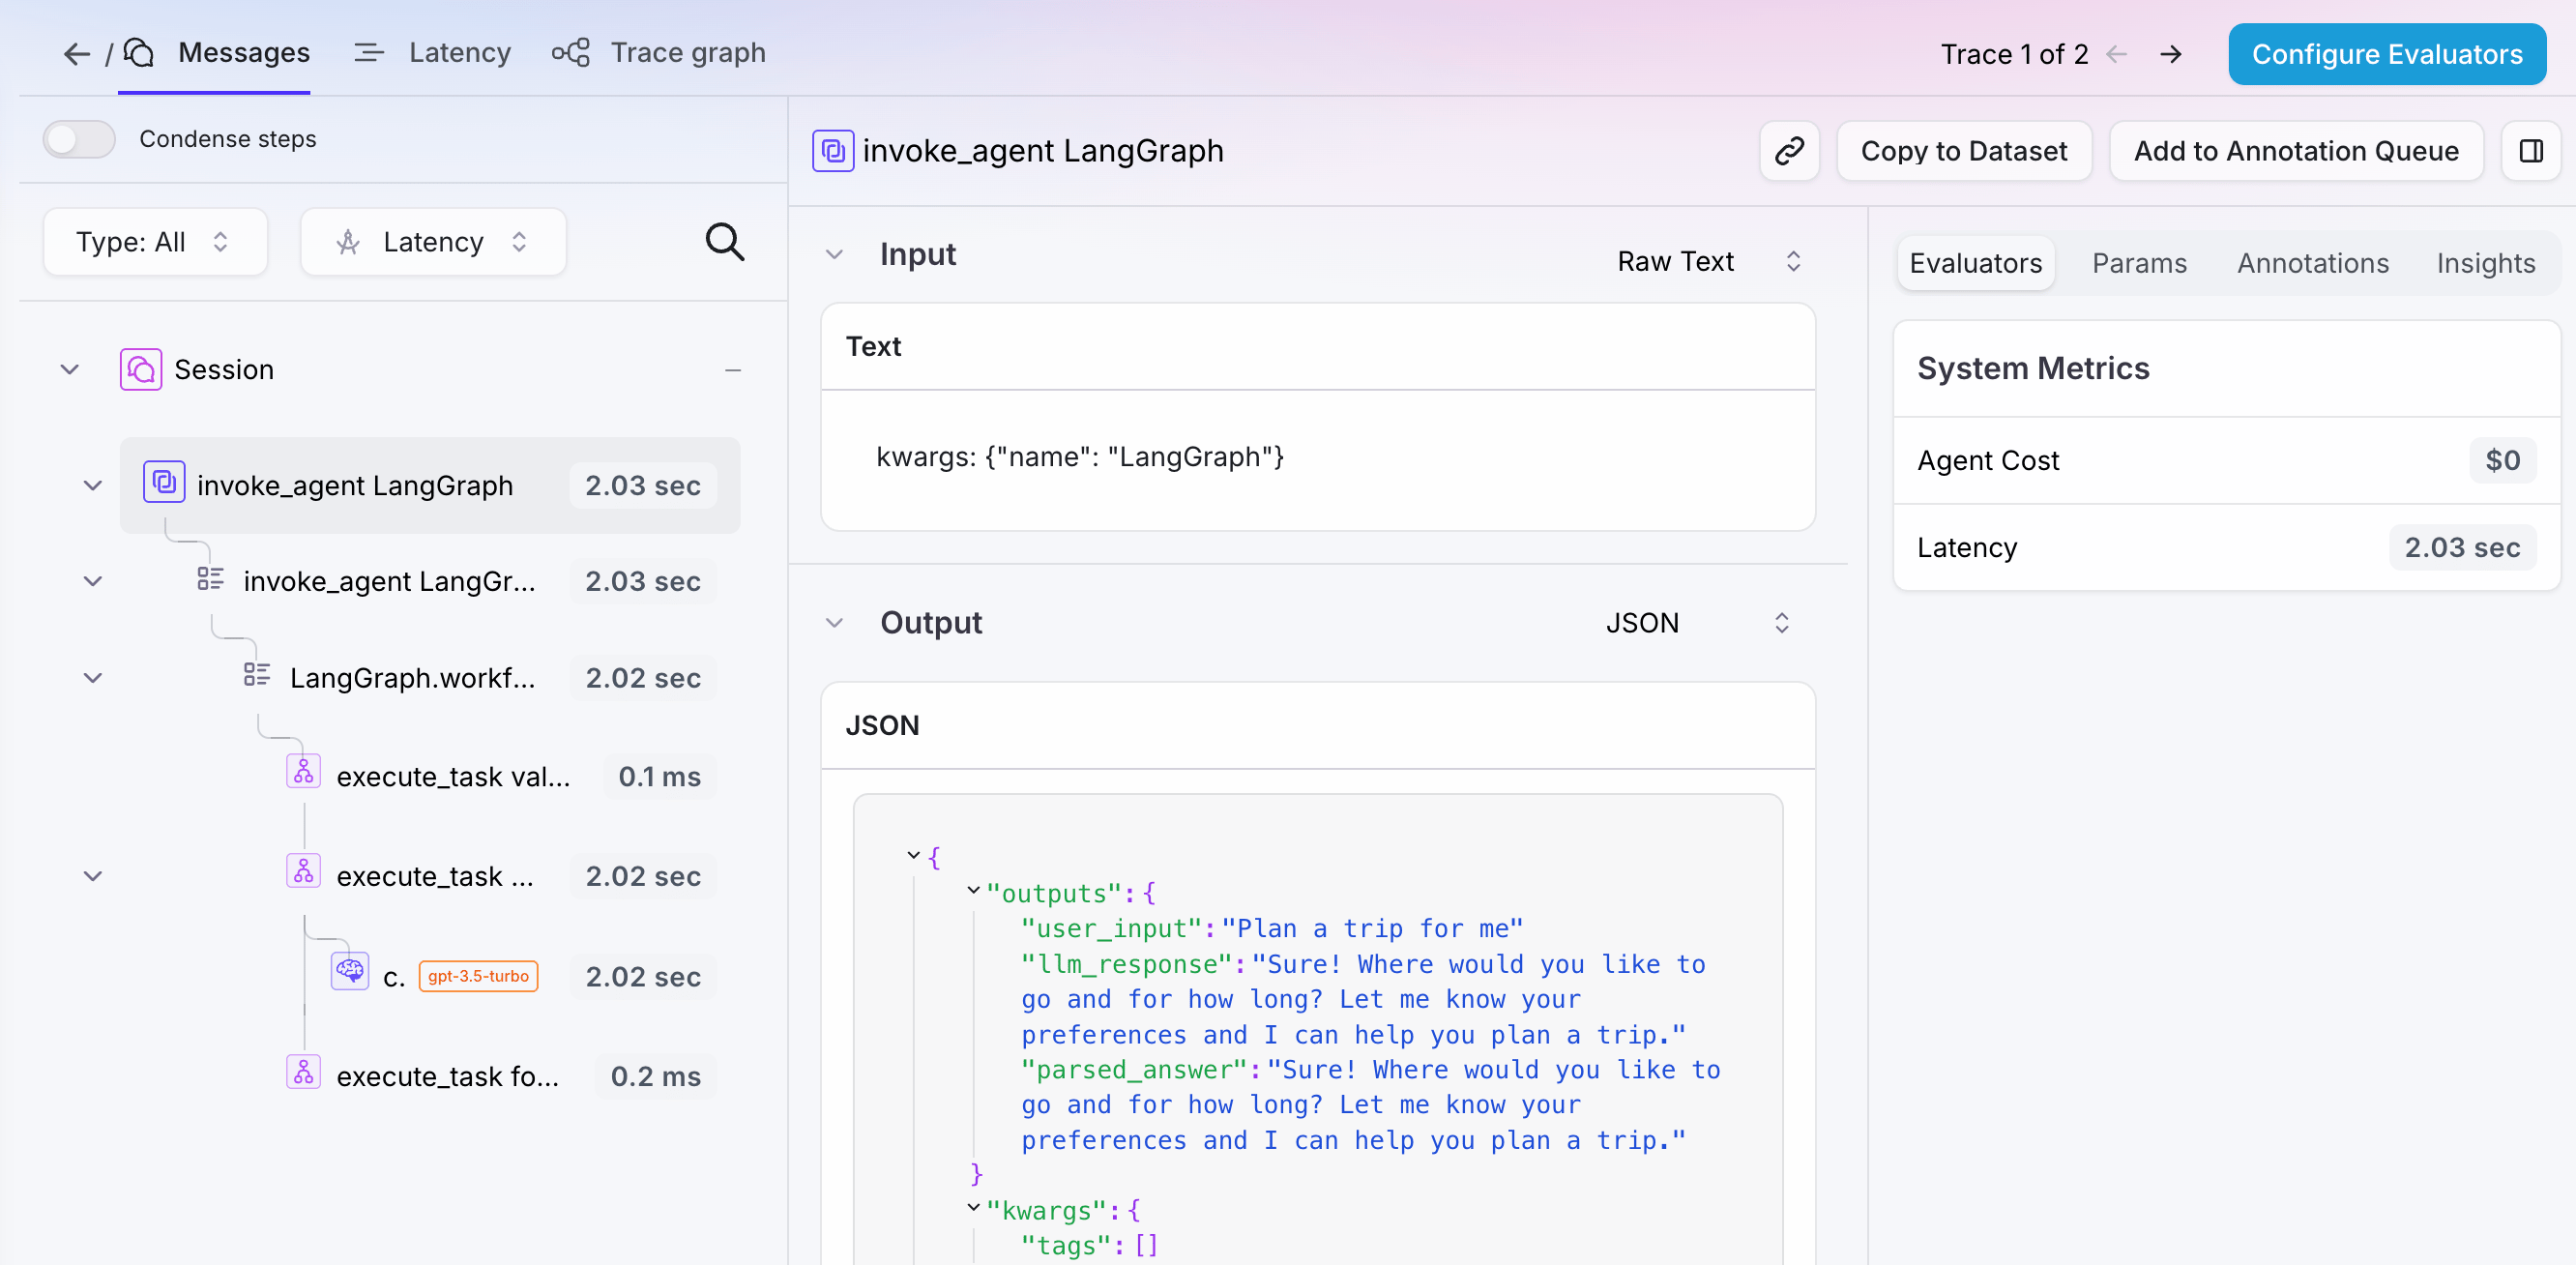
OpenInference semantic conventions for LangGraph—Advanced Usage
When running your LangGraph app with OpenInference, Splunk Agent Observability automatically applies semantic conventions to your traces, capturing model information, token usage, and performance evaluators without any additional code. For advanced use cases, you can also manually add custom attributes to enhance your traces with domain-specific information:1
Span attributes
Redacted data attributes: You can attach
splunk_ao.redacted_input and splunk_ao.redacted_output to any span in the trace (root or child) to send redacted versions of input and output alongside the originals. Splunk Agent Observability stores both and can restrict the original data to privileged users. Each attribute is independent — you can set one without the other for partial redaction.2
Events
Troubleshooting your LangGraph app
Here are some common troubleshooting steps when using OpenTelemetry and OpenInference.Headers not formatted correctly
Not seeing your OTel traces in Splunk Agent Observability? Double checker your header formatting. OpenTelemetry requires headers in a specific comma-separated string format, not as a dictionary.Wrong endpoint
Missing LangGraph instrumentation
Not seeing your LangGraph workflow traces? Ensure you’re instrumenting both LangGraph and the underlying LLM providers. LangGraph workflows require instrumentation at multiple levels to capture the complete execution flow.Next steps
LangGraph OTel Cookbook
Complete tutorial with working LangGraph example
LangChain Integration
Integrate with LangChain using Splunk Agent Observability callbacks
Custom Evaluators
Add custom evaluators to track your LangGraph app performance
Experiments
Run experiments on your instrumented LangGraph workflows