

Overview
This tutorial will guide you through creating and using a Session in Splunk Agent Observability, using a simple LLM-driven example that you can expand to multiple agents and data sources. It is a quick way to introduce you to logging sessions. By the end of this guide, you will know how to:- Initialize a logging session
- Add events to your session
- Inspect the Session in the Splunk Agent Observability UI to see all related Traces and Spans.
Prerequisites
- Splunk Agent Observability Account: Ensure you have signed up for a Splunk Agent Observability account and set up the required environment variables for your deployment type. For details, see the SDK overview.
- OpenAI API Key: This example will use OpenAI as the underlying LLM, so you will need an API key from them.
- Simple LLM Apps, and making simple OpenAI completion calls using Python
- The
SplunkAOLoggerclass from the Python SDK
Project setup
Let’s take a moment to prepare the development environment. If you already have a project setup withSplunk Agent Observability, LangChain, and LangGraph, you can skip right to Manage a Session. If not, here’s an abbreviated quickstart:
1
Install dependencies
We’ll need the Splunk Agent Observability Python SDK, LangChain, LangGraph, OpenAI, and
dotenv to pull in variables from your .env file. Let’s start by installing them:2
Create a .env file
Next, create a
.env file and add in the following variables:.env
3
Create your application logic file
Finally, create a main script file (e.g.
main.py or main.ts) where you’ll add and run your application logic.Manage a session
Recall our objectives from earlier? We’ll build a simple application and use it to work through each step. If you’re in a hurry, you jump to the full code sample here, then return to see how it was put together.Steps
1
Create a simple agent
In your main script, import the following dependencies. Let’s begin by creating a very simple agent using LangGraph and OpenAI:We’ll see
SplunkAOCallback and RunnableConfig in action later. For now, let’s move on to the next step.2
Create a Logger Instance
We’ll be using the
SplunkAOLogger to manage our logging session. Let’s create one next:Optional arguments for SplunkAOLogger
Optional arguments for SplunkAOLogger
SplunkAOLogger takes some optional arguments: you don’t have to provide any of them, but they are listed below so that you can see what is available.3
Start a logging session
Our simple application will have a
main function where everything happens. The first thing we will do in this function is start up a logging session. This will prepare the logger to group all captured events under a single session.Below, we give the session a unique name and external id. The name helps us find the session more easily in the Splunk Agent Observability UI. The external id is to link this session to external tracing: for example, linking to a conversation ID in your chatbot app by an ID created inside that app.You can also pass an optional metadata dictionary of string key-value pairs to attach structured information to the session, such as customer IDs, environment names, or application versions. Metadata keys appear as filterable columns in the Sessions table in the Splunk Agent Observability UI.Treat
logger.start_session like a lifecycle event, and call it before any code you want to monitor. The name, external id, and metadata arguments are all optional; name and external id are recommended.4
Add your LLM logic
Now you can interact with your LLM. Our very simple application will invoke the LLM with two questions: each question will be a question/answer exchange that generates a
Trace with child spans in our session. We will also pass a callback handler, which will be called by LangChain after each LLM invocation.Here’s our full main function: you can make this part as complex as you like!The SplunkAOCallback handler
SplunkAOCallback is a callback handler specifically for LangChain. It sends the most-recent captured traces to Splunk Agent Observability UI when it is called behind the scenes: your LLM logic determines what traces are generated and/or captured.
SplunkAOCallback optional parameters (click to expand)
SplunkAOCallback optional parameters (click to expand)
SplunkAOCallback has a few optional parameters:Full code sample
Here’s everything we have done so far:Full code sample (click to expand)
Full code sample (click to expand)
Run your script
That’s all the code: we have now learned to uselogger.start_session before starting LLM chat session, and supply SplunkAOCallback to ensure your traces get sent to the Splunk Agent Observability UI.
Now let’s run the script:
View your session
Now that you’ve logged a session, it’s time to view results.1
Log into Splunk Agent Observability and select your Agent Stream
Log into Splunk Agent Observability. Use the main menu to select a project, then select the Agent Stream where you were sending your session logs. If you didn’t specify a unique or new Agent Stream name, you will find the logs in your default Agent Stream.
2
Select your session
Selecting the Agent Stream will bring you to its event records. By default, all records will be grouped by Sessions. You can select the Sessions, Traces, or Spans tabs to change the event grouping.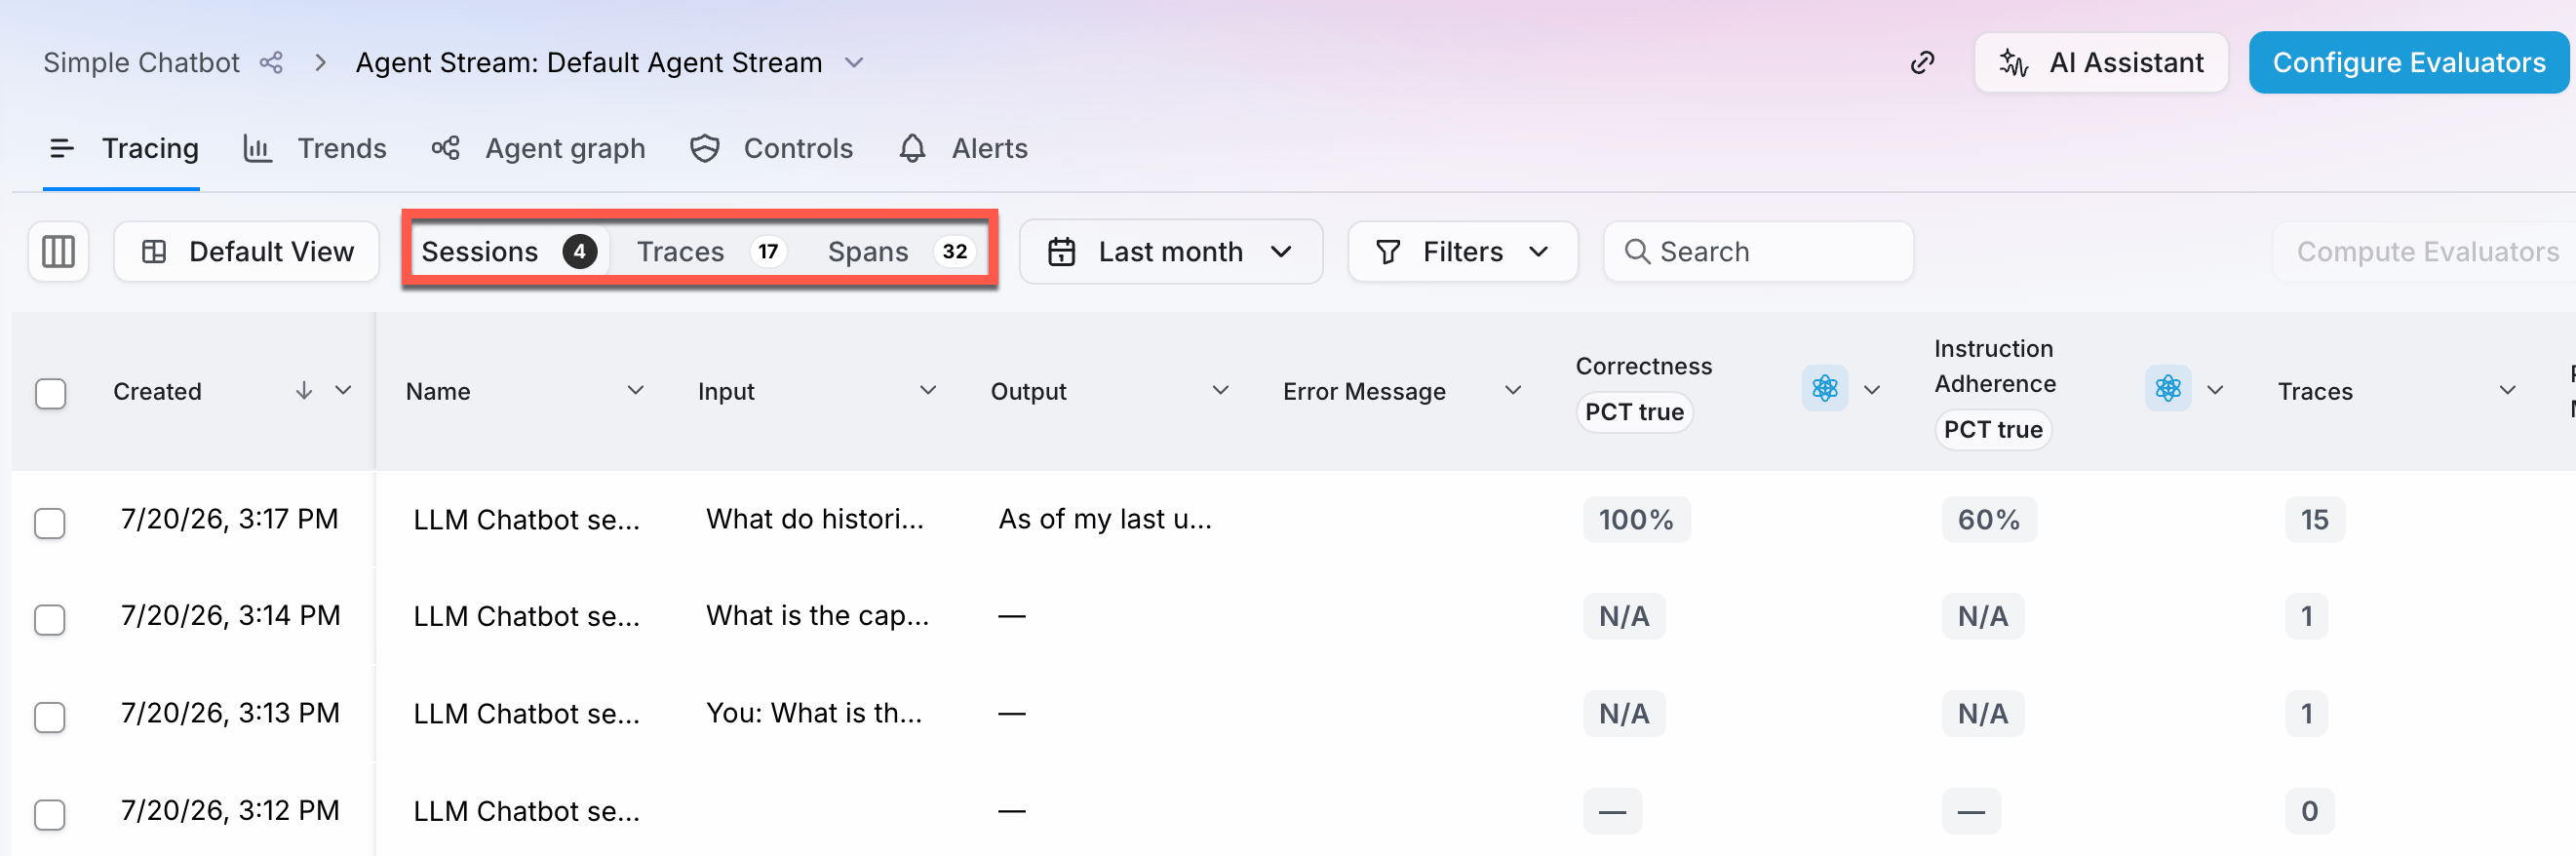
3
View your session
Once you select your session, select the Trace graph tab to see the Traces you captured from your test run as a flowchart. Any tools that were used will also show up as individual Spans.Select the nodes of the flowchart to see their inputs and outputs on your screen.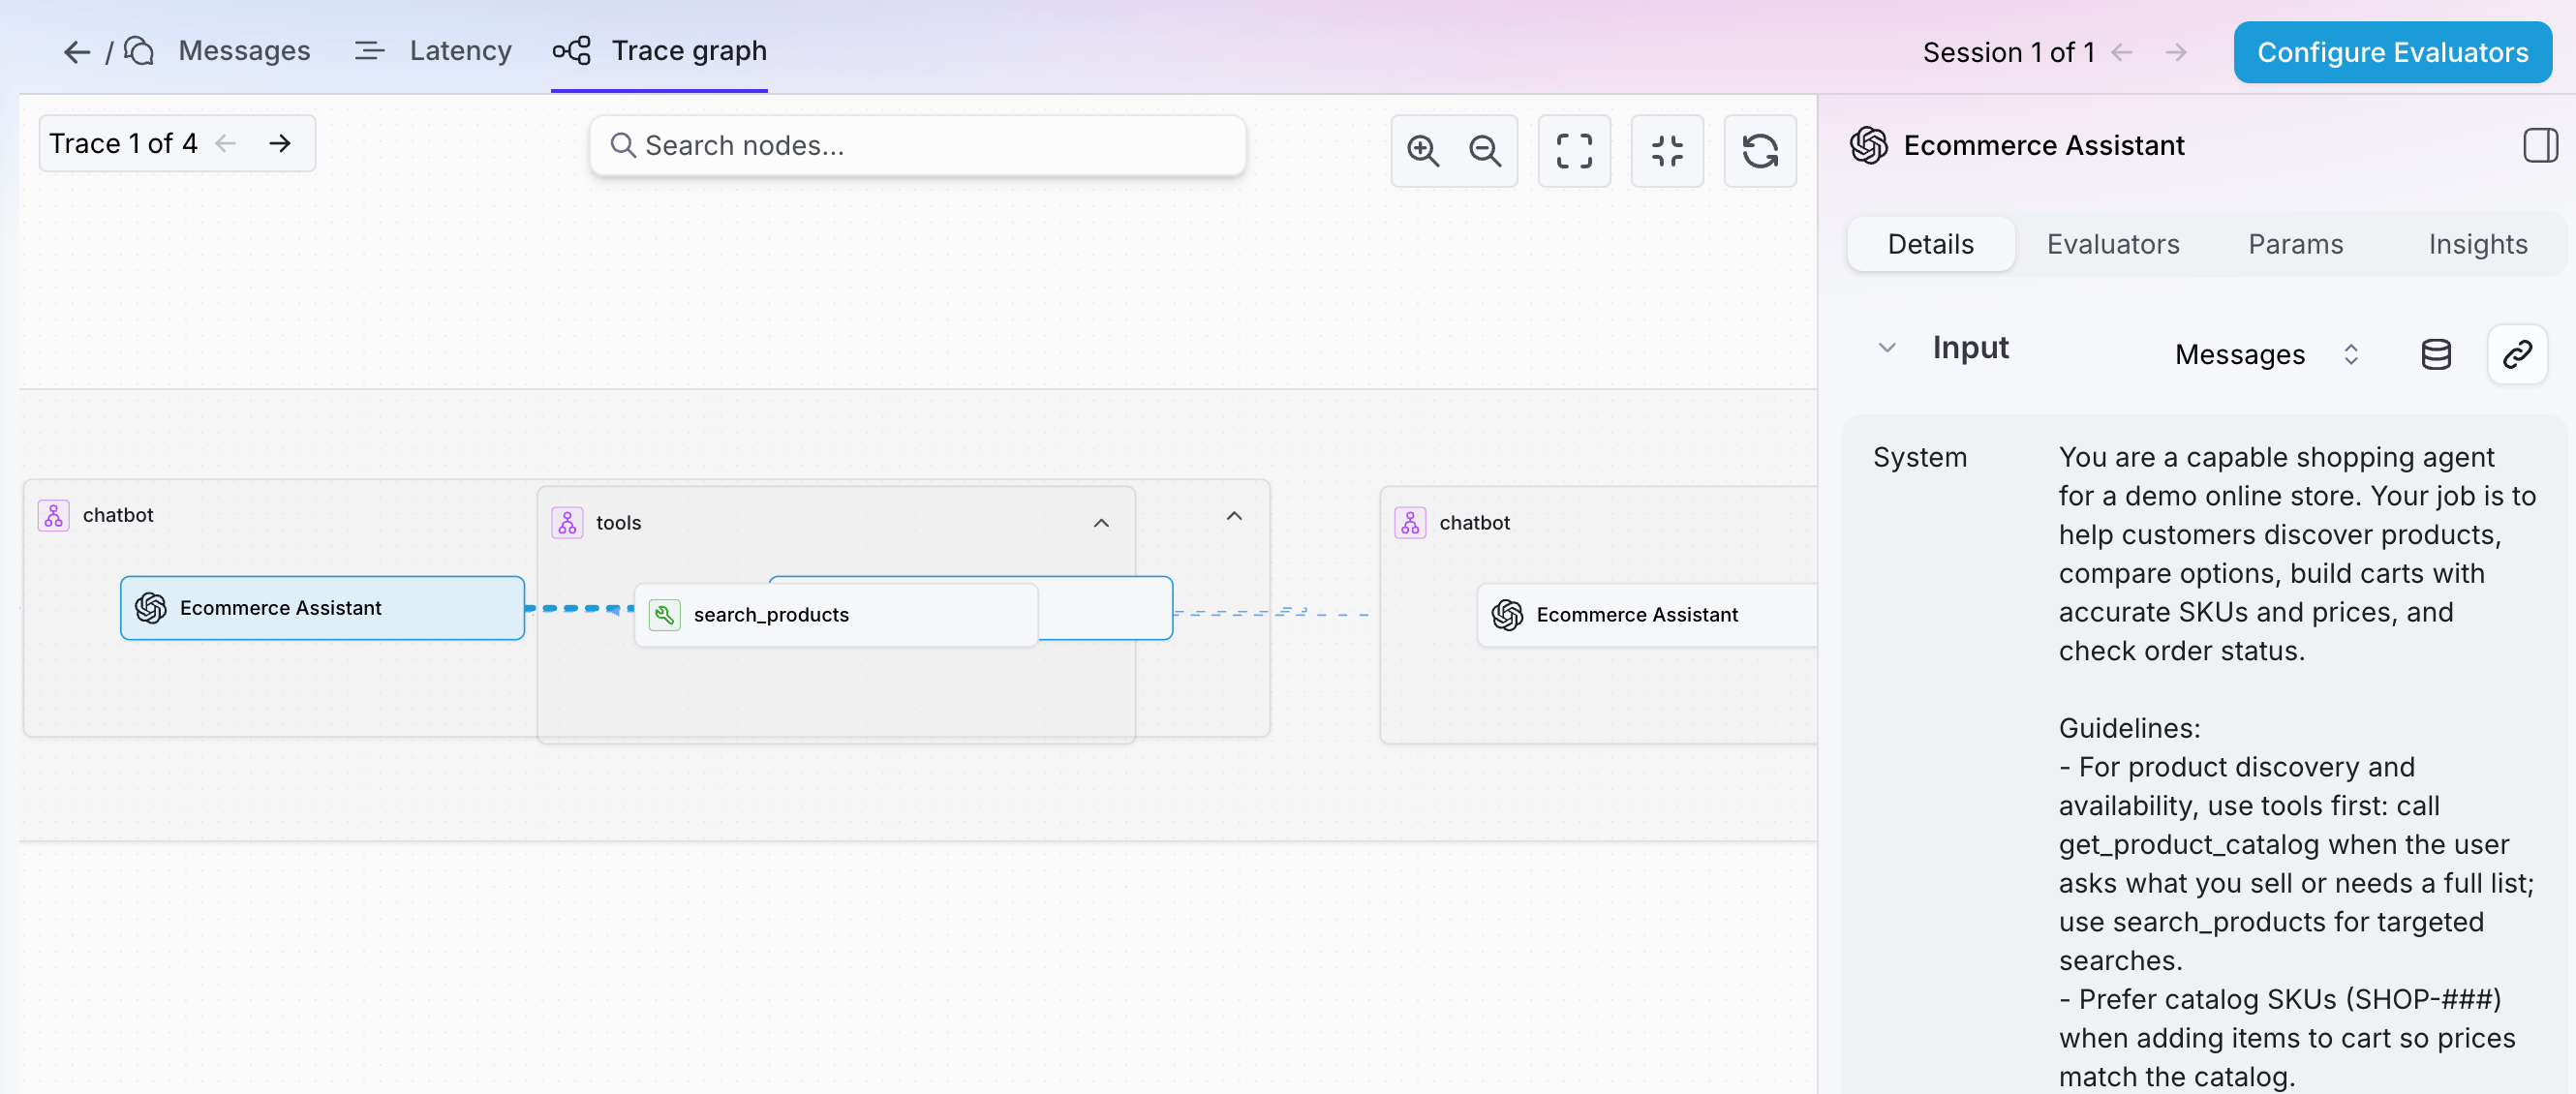
4
Optional: View individual Spans
Each message from the user and response from the LLM forms a single trace. You can view the contents here in a familiar format, as well as other details like tool calls. Select the Messages tab to see a list of traces in the session, along with their child spans. You can also select a span to see evaluators and other details on the right edge of the screen.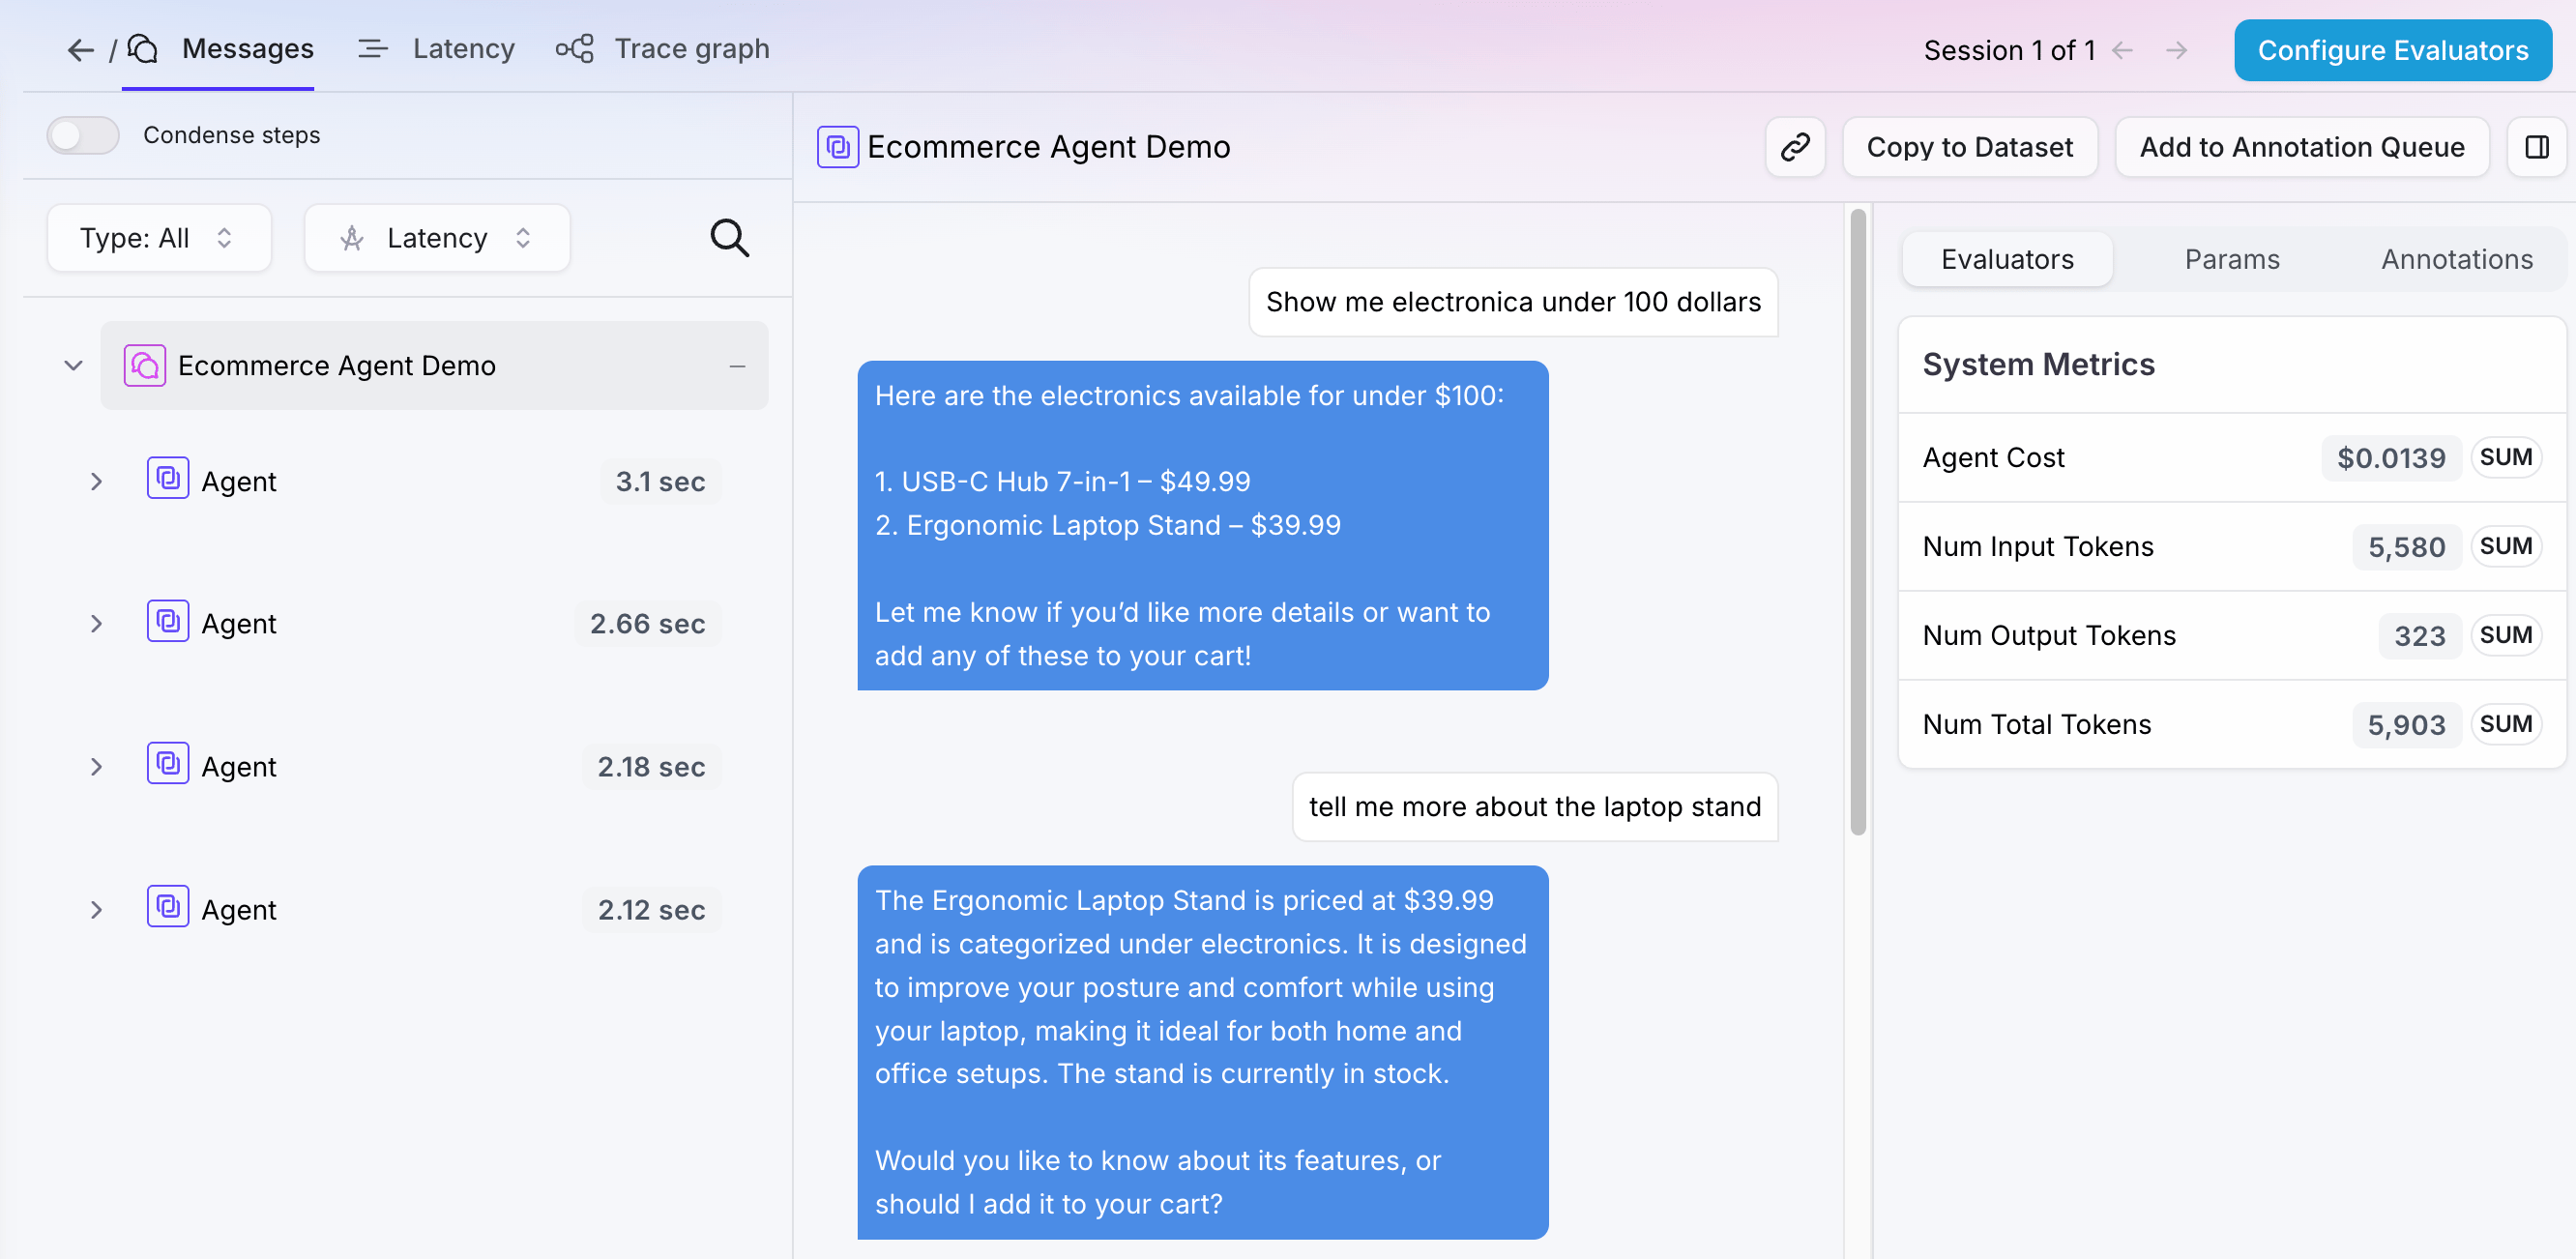
Additional considerations
Remember to always use the sameSplunkAOLogger instance across your project. This ensures that all captured events are placed in the same session. You can achieve this in a few ways:
-
Export your
loggerinstance from a separate module, so that your application uses a singleton instance. -
Use the Python SDK’s
splunk_ao_contextcontext manager for a consistent reference: -
You can also add
Traceswherever you see fit. ATracemight represent a question asked to your LLM, and the response generated for it — as well as any tools used! Splunk Agent Observability will generate traces for you, but you can also create new ones by using your logger instance:You can learn more about traces and how to use them in our logging guide.
Conclusion
In this tutorial, you learned how to:- Create a logging session with the
SplunkAOLoggerclass - Manually start your own session with the
logger.start_session()method - View your sessions in the Splunk Agent Observability UI.
Next steps
For a more detailed walkthrough of a multi-agent application, take a look at Monitoring LangChain Agents with Splunk Agent Observability. You can also learn more about using Splunk Agent Observability’s evaluators to gain more insight about your AI application.Related resources
- Sessions - An overview of sessions
- Splunk Agent Observability Context - Learn about the Splunk Agent Observability Context Manager
- Monitoring LangChain Agents with Splunk Agent Observability - Follow this cookbook recipe to create and evaluate a multi-agent application.