

Overview
Splunk Agent Observability enables you to get alerted whenever unexpected things happen. For example:- Your cost is higher than expected
- Your model is hallucinating more than you want
- Users are entering foul language into your app
Example alerts
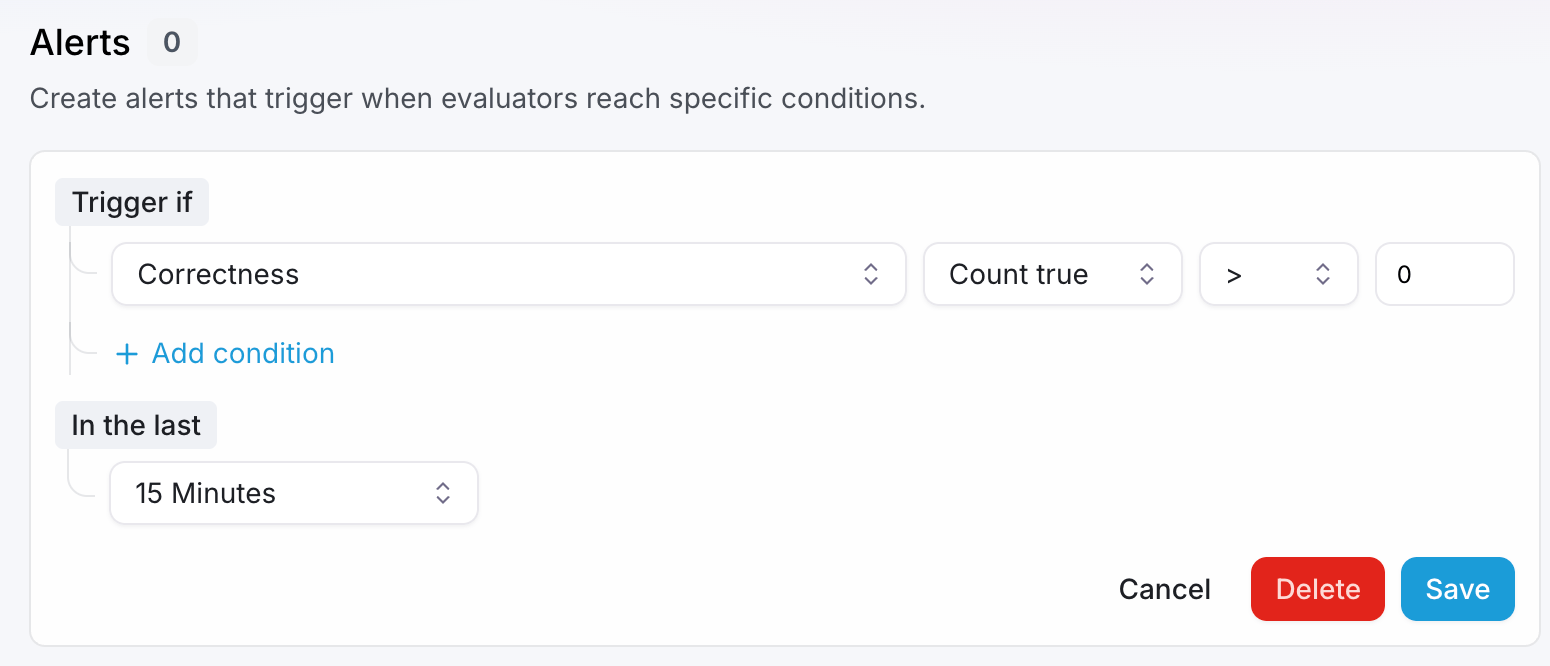
Each alert configuration includes:- an evaluator e.g. Cost, Correctness, Context Adherence
- an aggregation function: Average, Minimum, Maximum, Count, Sum
- a threshold e.g. < 0.5
- a time window e.g. 1 hour
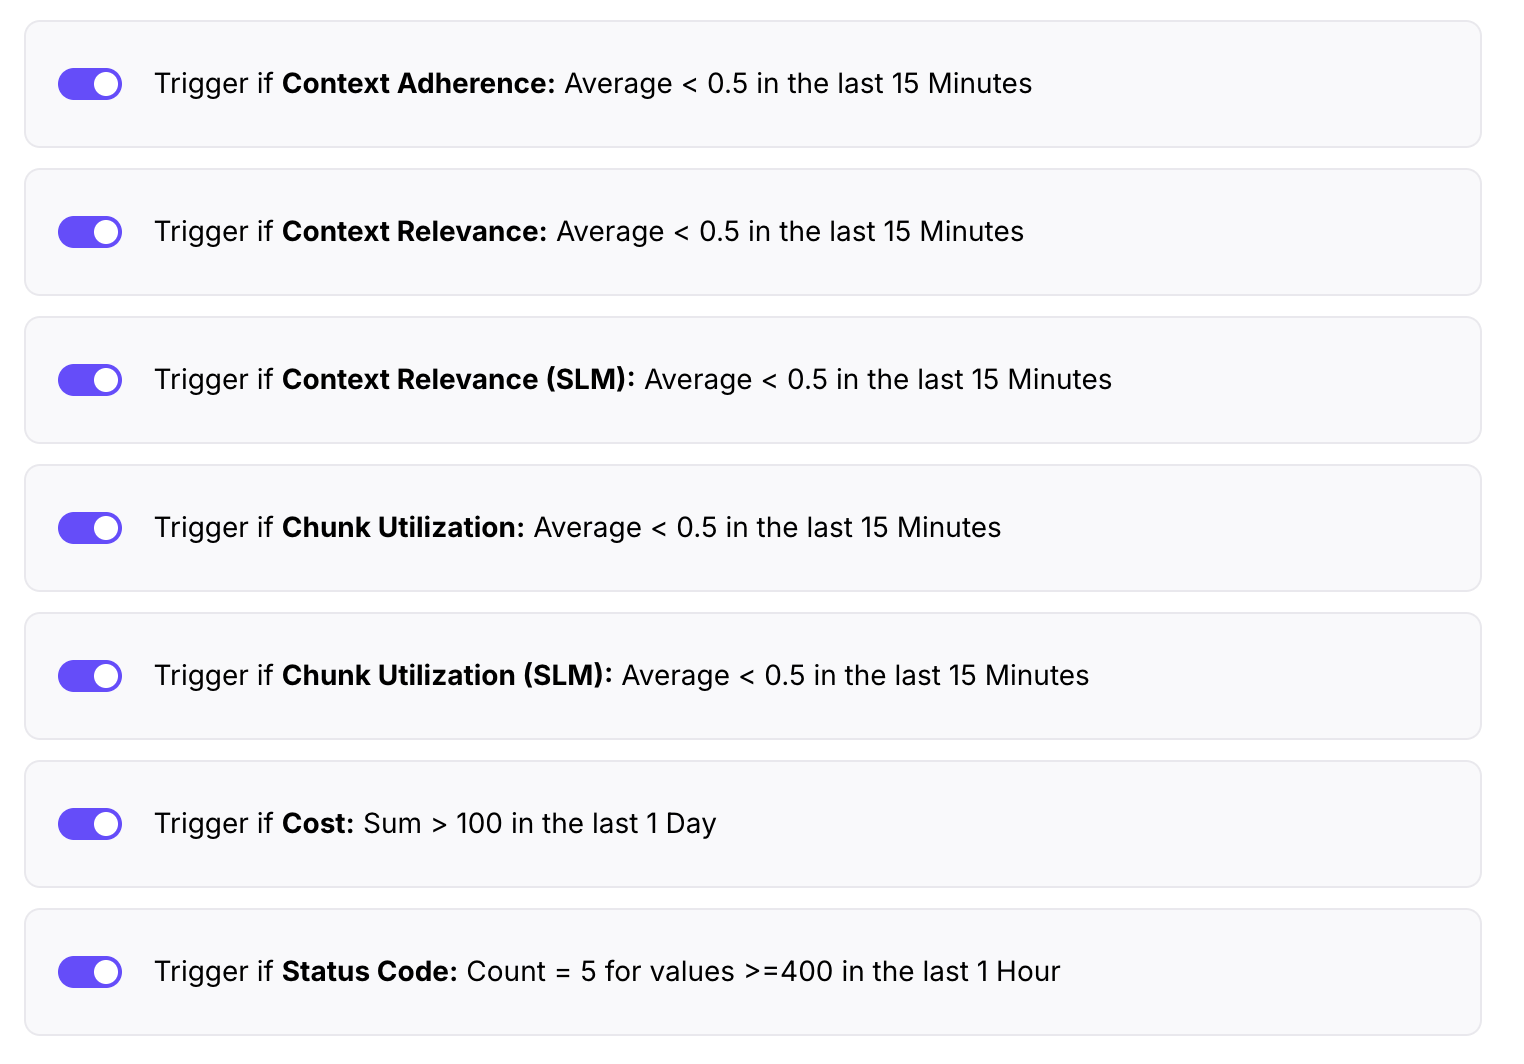
- Exceeding costs: If you want to get alerted with an uptick in cost (above $100/day), select
CostSum > 100 in the last day - Hallucinations: If you want to get alerted when there’s an extreme hallucination, select
CorrectnessorContext AdherenceCount = 1 for values = 0 in the last 15 minutes. - Hallucination average: If you want to get alerted when hallucinations are probable (e.g. more than 50% below perfect threshold), select
CorrectnessorContext AdherenceAverage < 0.5 in the last 1 hour.
Email notifications
To set up email alerts, use the main menu to select your project. Select an Agent Stream and select the Alerts tab. Under Notifications, add your recipients’ email addresses. When emails have been added, the top right corner of the section will show Active. From the email notification (example below), you can select the Open Agent Stream button to find the problematic traces.Slack notifications
To set up Slack alerts, you’ll need to configure your workspace to receive Slack messages via webhook URLs. Follow Slack’s instructions to generate a webhook URL. A few pointers:- Create a Slack app. If you don’t have an existing manifest file, choose the “From scratch” option to create the app.
- Pick an App Name like “Splunk Agent Observability Alerts” that will help identify the Slack app that the notifications will come from.
- Go to the “Incoming Webhooks” page of your Slack app (under “Features”), and enable the toggle to “Activate Incoming Webhooks”.
- Click “Add New Webhook” and choose the Slack channel you’d like Splunk Agent Observability’s Alerts to go to. (You can also test the webhook by direct messaging your user account.)
- Copy the generated webhook URL from Slack. Navigate to your Agent Stream, select the Alerts tab, and paste the URL into the Slack Notification section.
- In the “Notes” section, add the name of the channel that will receive notifications.
- Try sending a test message to webhook to verify the connection.
Generic webhook notifications
Generic webhooks let you send Splunk Agent Observability alert events to any HTTP endpoint — for example, a custom alerting system, an incident management platform like PagerDuty or IBM Tivoli Netcool/OMNIbus, or an internal automation pipeline. Unlike Slack notifications (which are formatted for human reading), generic webhooks deliver a structured JSON payload designed for machine consumption. Every delivery includes the exact evaluator value that triggered the alert, a uniquededup_key for correlating trigger and clear events, and a metadata field you control. You can use the metadata field to route events to the right team or tag payloads with environment context.
Configure the webhook
- In the Webhook (Generic) section, enter the destination URL of your endpoint.
-
Optionally, add a Name to identify this webhook (for example,
PagerDuty - Platform Team). -
Select an Auth type:
- None — no authentication headers are added.
- Header token — adds an
Authorization: Bearer <token>header. Enter your token in the Token field. - HTTP Basic — adds a
Basicauth header. Enter your Username and Password.
The token or password is write-only. Splunk Agent Observability never returns it after saving. If you edit the webhook later, you will need to re-enter the credential to save changes. -
Optionally, add Metadata key-value pairs. These are forwarded unchanged in the
metadatafield of every payload Splunk Agent Observability sends to this endpoint. Use this to attach routing or context information your downstream system needs — for example:Your system receives these fields as-is inside the payload, so you can use them to route alerts, filter noise, or set incident priority without having to parse the alert content. - Click Add to save the webhook.
Test the connection
After saving, the webhook shows as Configured. Click Send test event to send a synthetic alert payload to your endpoint. If your endpoint responds successfully, the badge updates to Active. If your endpoint does not respond successfully, the badge updates to Failed. Check the URL and auth settings, then click Send test event again to retry.Webhook payload
When an alert triggers, Splunk Agent Observability sends aPOST request to your endpoint with a JSON body in the following format:
conditions[].observed_value— the actual evaluator value at the time of the alert, not just the threshold. Use this to set incident severity or include it in notification copy.dedup_key— stable identifier for this alert instance. Use it to correlate a trigger event with its corresponding clear event, or to avoid duplicate re-deliveries.deep_link— a direct link into the Splunk Agent Observability UI scoped to the time window and filters active when the alert fired.metadata— the key-value pairs you configured on the webhook. Forwarded unchanged so your system can route or annotate without parsing alert content.version— always"1.0". Will be incremented if the payload structure changes in a breaking way.